Master Market Equilibrium with the Accumulative Swing Index (ASI) for MT4
In the pursuit of technical mastery, traders often find themselves deceived by the "surface level" of Price Action. Standard candlestick charts show you the high, low, open, and close, but they rarely reveal the true structural integrity of a trend. The Accumulative Swing Index (ASI) for MetaTrader 4 (MT4) is a professional-grade indicator designed to look deeper. Developed by the legendary Welles Wilder, the ASI is a cumulative total of the Swing Index, designed to provide a "phantom" price line that reveals the market's true momentum and identifies high-probability breakouts before they appear on traditional charts.
The Logic of the "True" Price Line
The ASI is unique because it uses a complex mathematical formula to compare the current bar’s price action with the previous bar’s data. It factors in the relationship between the current close and previous close, as well as the limit move of the day. The result is a fluid line that represents the "real" strength of the market, effectively filtering out the noise that often leads to false breakouts.
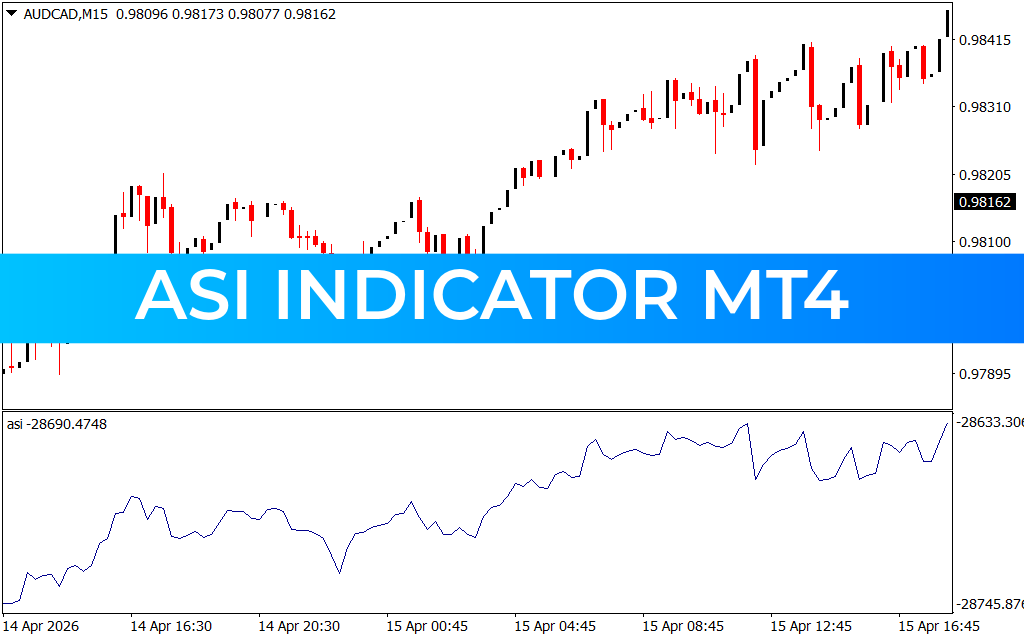
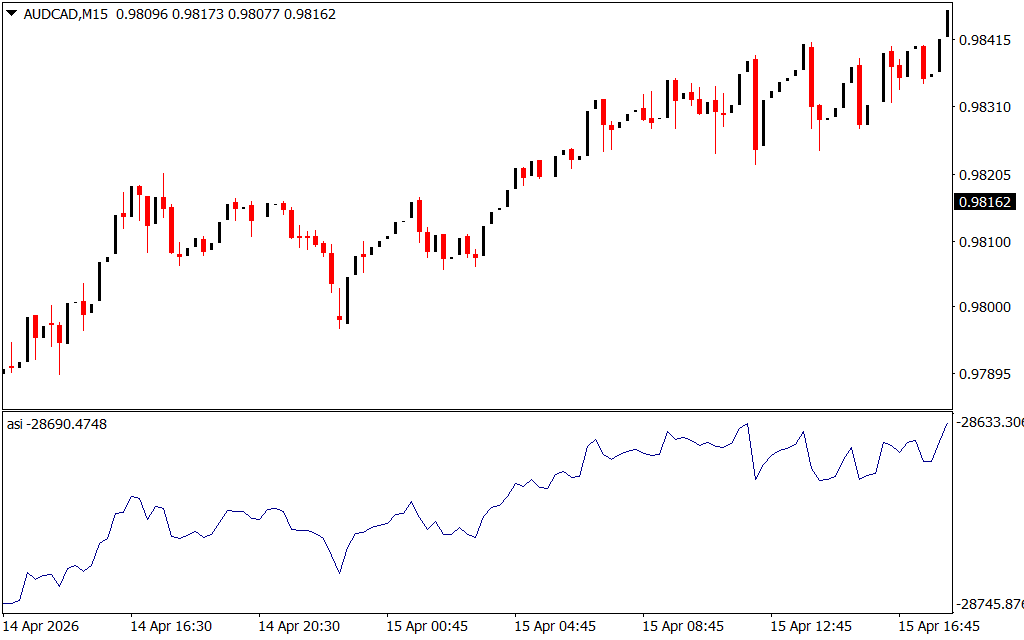
As demonstrated in technical analysis on high-liquidity structures like AUD/CAD on the M15 timeframe, the ASI provides a definitive operational advantage:
- Identifying Real Trend Lines: One of the most powerful applications of the ASI is trend line analysis. Traders often find that drawing trend lines on the ASI is more accurate than drawing them on price bars. As seen on recent M15 charts, when the ASI line breaks a trend line, it frequently serves as a leading indicator that price is about to follow suit.
- The Power of Convergence: The ASI is designed to mirror price action. When price makes a new high and the ASI also makes a new high, the trend is considered structurally sound. However, if the ASI fails to confirm a new price high, it signals a "hidden" weakness, warning professional traders of an impending reversal.
- Mechanical Breakout Confirmation: The ASI is world-class at confirming chart patterns. Whether you are trading a head-and-shoulders, a triangle, or a simple support/resistance flip, a corresponding breakout on the ASI line provides the institutional "green light" needed to execute with confidence.
- Filtering Market Volatility: By focusing on the cumulative swing value, the ASI ignores the erratic "wicks" and price spikes that trigger stop-losses. It stays focused on the conviction of the close, providing a smoother experience for trend-following strategies.
Strategic Implementation for Systematic Success
The ASI Indicator is an essential asset for any trader who values a disciplined, data-driven approach.
- Trend Confirmation: Use the ASI to validate your bias. If the ASI is trending upward and staying above its recent swing lows, look for buying opportunities on price pullbacks.
- Surgical Exit Timing: Monitor the ASI for "rounding tops" or "bottoms." When the accumulative momentum begins to plateau while price is still rising, it is a clear signal to scale out of positions.
- Cross-Timeframe Synergy: Align the ASI across timeframes. A bullish breakout on the H1 ASI combined with a fresh trend line break on the M15 ASI creates a top-tier trade setup with a high probability of success.
Conclusion
The Accumulative Swing Index (ASI) for MT4 is a definitive solution for traders who demand structural clarity. By bridging the gap between raw price action and cumulative momentum, it empowers you to navigate the financial markets with institutional-grade confidence. Elevate your technical analysis today and discover the true strength of the trend with the ASI system.
1 Download
Last Update:
Apr 18, 2026 13:06 PM
Published:
Feb 06, 2026 18:03 PM
Category: