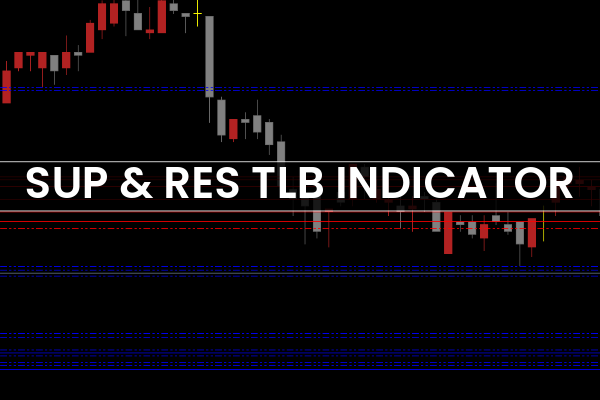
The Sup & Res TLB Indicator for MT5, also known as the Support and Resistance Indicator, is a powerful technical tool designed to help traders easily visualize key market levels where price is likely to pause, reverse, or break out.

Support and resistance are the foundation of technical analysis — they represent areas where buying and selling pressure often shift, creating high-probability trading zones. This indicator automatically plots these zones on your MetaTrader 5 chart, eliminating the need for manual drawing and analysis.
What sets this indicator apart is its ability to display multi-timeframe support and resistance levels on a single chart. For instance, you can view daily, weekly, and monthly levels simultaneously, making it easier to align short-term entries with higher timeframe structures.
Whether you are a beginner learning to recognize market turning points or an advanced trader refining your entry strategy, the Sup & Res TLB Indicator for MT5 provides a clean, efficient, and insightful approach to market structure analysis.
The Sup & Res TLB Indicator automatically detects and plots horizontal price zones where the market has historically reversed or consolidated. These zones are identified as support (S) and resistance (R) levels.
Support Levels (S): Areas where price tends to find demand and bounce upward.
Resistance Levels (R): Areas where price tends to face supply and move downward.
The indicator uses price action data from multiple timeframes to determine the most relevant levels. Each level is labeled according to its timeframe — such as D1 (Daily), W1 (Weekly), or MN (Monthly) — allowing you to quickly see how short- and long-term market structures align.
This multi-timeframe visualization gives traders a deeper market perspective, helping identify confluence zones — areas where several timeframe levels overlap, often leading to strong price reactions.
By default, when trading on the daily (D1) chart, you’ll see the daily, weekly, and monthly support and resistance levels plotted automatically. This setup helps identify the most influential zones in the market.
For example:
D1 Res: Indicates a daily resistance area — often good for short (sell) opportunities.
W1 Sup: Represents a weekly support level — ideal for watching potential reversals or buy setups.
If you prefer a more customized approach, you can easily enable or disable specific timeframes in the settings to match your trading strategy.
Support and resistance levels are key decision zones for traders. The Sup & Res TLB Indicator helps you act decisively by showing you where these zones are strongest.
Buy Setup Example:
Wait for the price to approach a support level (e.g., D1 Sup or W1 Sup). If the price forms a bullish candlestick pattern or bounces upward, consider entering a buy trade.
Sell Setup Example:
When the price nears a resistance level (e.g., D1 Res), look for bearish confirmation signals such as rejection wicks or bearish engulfing patterns before entering a sell trade.
These setups are even stronger when multiple timeframes align — for instance, when daily and weekly resistance levels overlap.
While the Sup & Res TLB Indicator is powerful on its own, combining it with other tools can enhance its accuracy. For example:
Use it with RSI or Stochastic Oscillator to confirm overbought/oversold conditions near key levels.
Pair it with trend indicators like Moving Averages to determine if the market is more likely to break or bounce from support/resistance zones.
No need to manually draw or adjust support/resistance lines — the indicator automatically identifies and updates levels in real-time.
View daily, weekly, and monthly levels together for deeper market insight and stronger confirmation.
Beginners can quickly identify reversal points, while advanced traders can refine entries using price action and confluence analysis.
Whether you trade forex, indices, or commodities, this indicator works across all instruments and timeframes.
In summary, the Sup & Res TLB Indicator for MT5 simplifies the process of identifying support and resistance zones, which are among the most crucial elements of technical trading. It enables traders to visualize key price areas from multiple timeframes on one chart, helping to pinpoint reversal zones, breakouts, and trade setups with greater precision.
If you’ve ever struggled to manually plot reliable levels or missed opportunities due to unclear market structure, this indicator can dramatically improve your trading workflow.
You can download the Sup & Res TLB Indicator for MT5 for free at IndicatorForest.com and start using it to improve your chart analysis and timing of entries and exits.
Published:
Nov 04, 2025 15:33 PM
Category: