The KAMA Indicator for MT4—short for Kaufman’s Adaptive Moving Average—is a powerful and dynamic trend-following tool designed to adjust to changing market conditions. Unlike traditional moving averages that lag behind price, the KAMA indicator uses volatility and market efficiency to “hug” the price during ranging periods and widen its distance during strong trends. This adaptive behavior helps forex traders understand whether the market is trending or consolidating and make informed buy or sell decisions. Available as a free and easy-to-install MT4 indicator, KAMA is useful for both beginners and advanced traders.
What Is the KAMA Indicator for MT4?
Developed by Perry Kaufman, the KAMA indicator is an enhanced version of the traditional moving average, built to reduce lag and filter out noise. During low-volatility or sideways markets, the adaptive moving average contracts and follows the price closely. When volatility increases, it expands and gives the price more room, allowing traders to identify Trend Strength and potential breakouts clearly.
Why KAMA Stands Out
Adaptive nature – adjusts automatically to volatility
Reduced lag compared to standard moving averages
Clearer trend visualization
Useful across multiple timeframes (H1, H4, daily, weekly, monthly)
These features make the KAMA ideal for top-down technical analysis and intraday strategies.
How to Use the KAMA Indicator for MT4
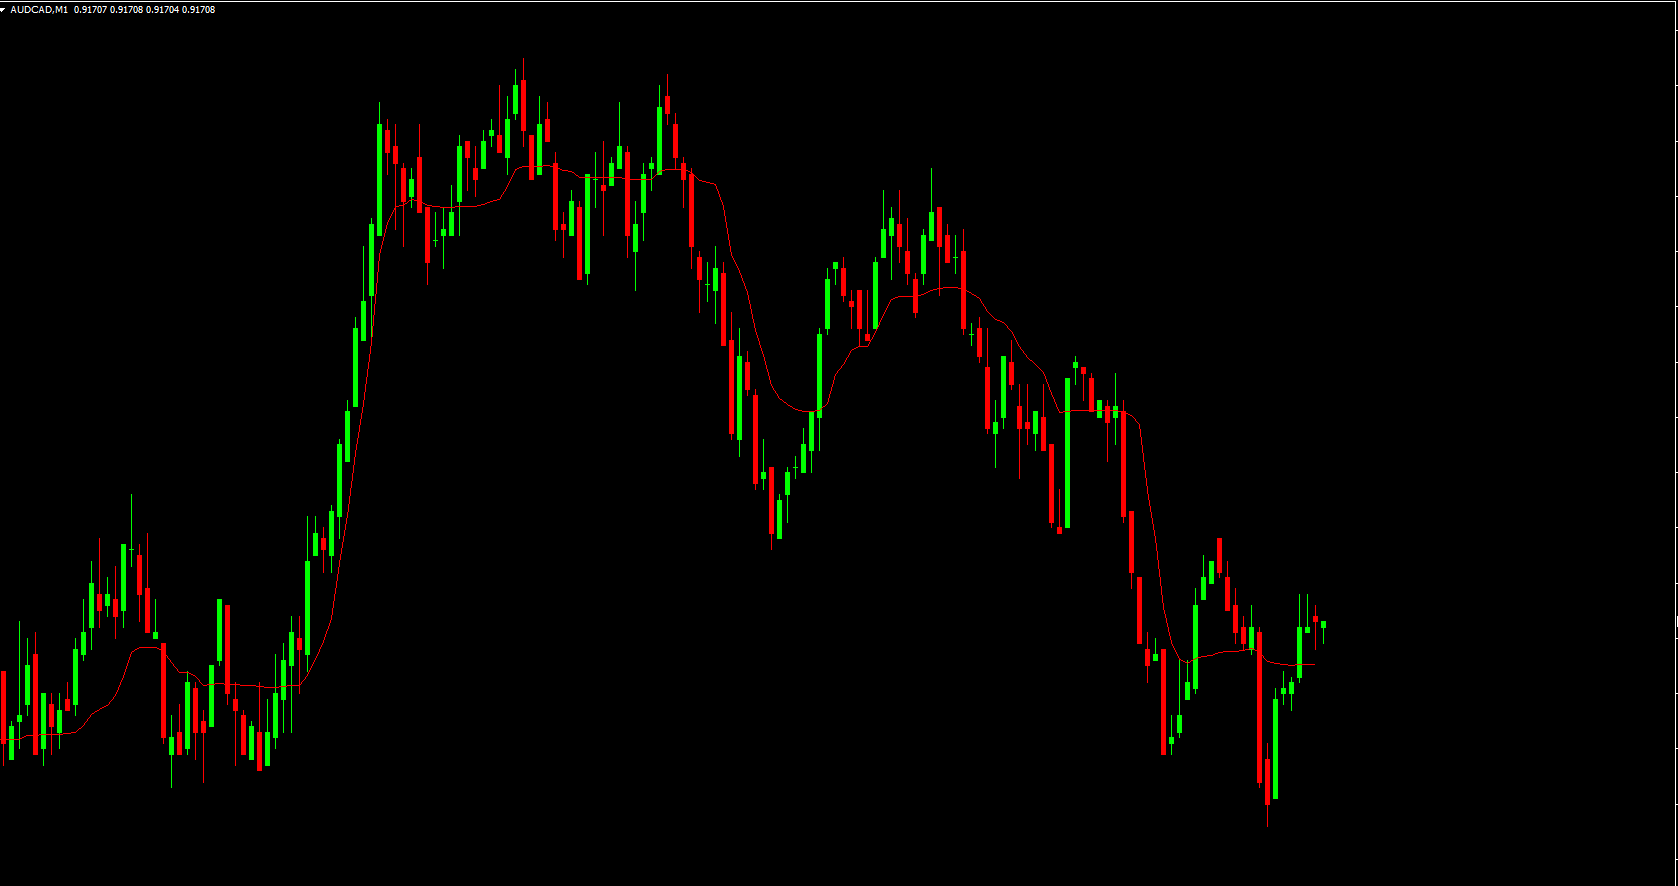
The indicator works across all MT4 chart types, including candlesticks, bars, and line charts. Traders can use it to confirm trends, spot reversals, and filter out market noise.
Identifying Trending vs. Ranging Markets
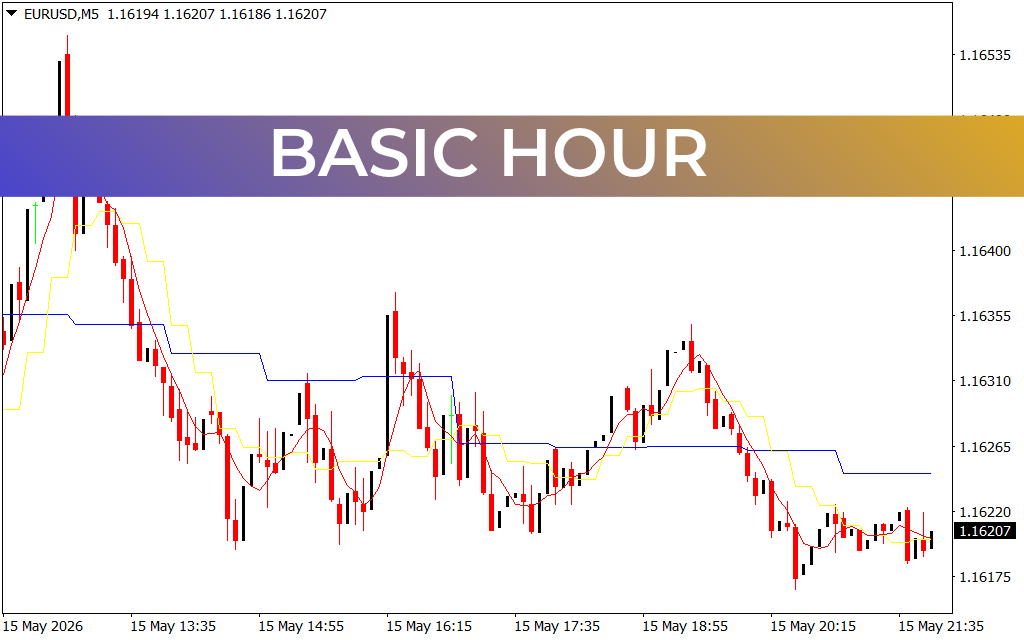
Flat or horizontal KAMA line → indicates a ranging or weak market. Traders should avoid entering positions during these quiet phases.
Upward-sloping KAMA line → signals a bullish trend.
Downward-sloping KAMA line → signals a bearish trend.
This makes it easy for new traders to spot market conditions and adjust their trading strategies.
KAMA Indicator Trading Signals
On charts like AUDUSD H1, the KAMA plots as a smooth line, often blue in many custom MT4 versions. Price crossing above or below the KAMA line generates directional signals.
Bullish Signal
A bullish opportunity occurs when:
Price closes above the KAMA line
Market shows increasing volatility
KAMA line points upward
Traders typically enter a buy trade with the stop loss placed below the most recent swing low. Since the KAMA does not provide built-in profit targets, traders use risk-to-reward ratios or support/resistance levels.
Bearish Signal
A bearish trend is indicated when:
Price closes below the KAMA line
The KAMA slopes downward
This encourages traders to enter a sell trade, placing stop loss above the swing high.
Using Slow vs. Fast KAMA
Although some traders combine multiple KAMA indicators (fast and slow variants), this approach often introduces lag. A = Best Practices and Limitations
The KAMA indicator is highly effective but not perfect. Because it sometimes follows price too closely, false signals may occur—especially in choppy markets. To reduce risk:
Confirm signals with Price Action, support/resistance, or volume indicators
Avoid using the KAMA alone during low-volatility sessions
Always use stop-loss orders
For improved results, combine the KAMA with trendlines or higher-timeframe analysis.
Conclusion
The KAMA Indicator for MT4 is one of the most effective adaptive moving averages available to forex traders. Its ability to adjust to market volatility makes it valuable for trend identification and dynamic trading strategies. Whether you are a new trader or an advanced analyst, the KAMA helps enhance market clarity and decision-making.
For more forex tools, powerful indicators, and premium strategies, visit IndicatorForest.com.
FAQ
16 Downloads
Published:
Nov 13, 2025 23:17 PM
Category: