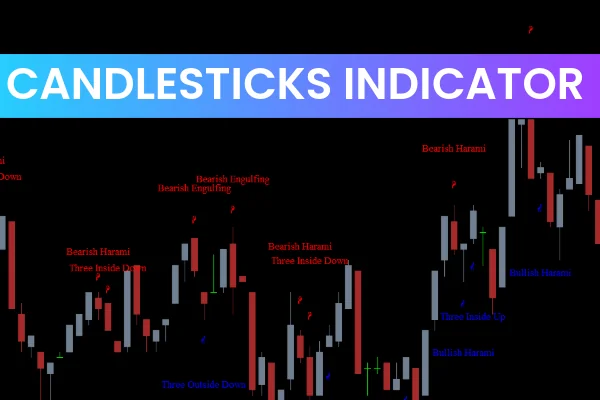
The Japanese Candlestick Patterns Indicator for MT4 is an automated tool designed to help traders recognize candlestick patterns without memorizing their names. By detecting price structures and market sentiment automatically, this indicator enables both beginners and experienced traders to interpret market trends and potential reversals with confidence. Available at IndicatorForest.com, it’s a must-have for anyone using price-action trading strategies.
Why Use the Japanese Candlestick Patterns Indicator
Candlestick charts are one of the most widely used tools in Forex and stock trading. They provide more detailed insight than line or bar charts and clearly reflect market sentiment, momentum, and potential reversal points.
The Japanese Candlestick Patterns Indicator:
Automatically detects patterns: Scans the chart after each candle closes.
Shows historical patterns: Displays detected candlestick patterns over the past 200 bars.
Simplifies trading decisions: No need to memorize dozens of pattern names or formations.
Supports beginners: Helps traders understand price structure and market sentiment easily.
How to Use the Japanese Candlestick Patterns Indicator in MT4
Understanding Candlestick Patterns
Candlestick patterns display the open, high, low, and close prices of a financial instrument over a chosen timeframe. Each pattern reflects potential market sentiment and helps traders anticipate future price movements.
Step-by-Step Trading Guide
Install the Indicator: Add it to your MT4 platform.
Observe Detected Patterns: The indicator scans and shows candlestick patterns automatically.
Combine with Trend Indicators: While the indicator shows potential reversal patterns, combining it with a trend-following tool like a 10-day simple moving average (SMA) can improve trade accuracy.
For example, on a bullish trend above the 10-SMA, prioritize buy signals from bullish candlestick patterns.
For counter-trend opportunities, a bearish pattern near a resistance level may signal a potential sell.
Enter Trades: Use the patterns in alignment with your trading strategy for entries and exits.
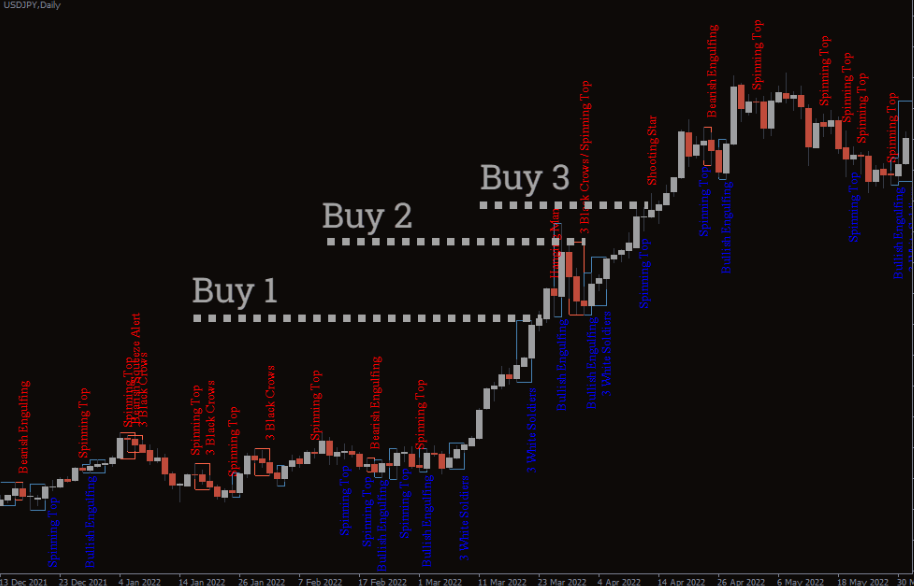
Example Application
On a daily USD/JPY chart with a 10-day SMA:
Bullish candlestick patterns above the SMA led to successful upward runs.
Bearish engulfing patterns near resistance indicated potential trend reversals, signaling sell opportunities.
Benefits of Using the Japanese Candlestick Patterns Indicator
Time-Saving: No need to manually identify patterns.
Automatic Detection: Patterns are scanned and displayed in real time.
Improved Accuracy: Helps traders confirm trades with clear visual signals.
Enhanced Price-Action Understanding: Beginners can quickly learn how candlestick structures reflect market sentiment.
Flexible Trading: Works for intraday, swing, and long-term trading strategies.
Conclusion
Candlestick charts have become a cornerstone of modern trading due to their clarity and detail. The Japanese Candlestick Patterns Indicator for MT4 automates the detection process, making it easier for traders to identify potential reversals and follow market trends. By combining it with trend indicators or other trading tools, you can make more informed decisions and enhance your price-action trading strategy.
Download the Japanese Candlestick Patterns Indicator today from IndicatorForest.com and start exploring the power of automated price-action analysis.
FAQ
6 Downloads
Published:
Nov 11, 2025 13:56 PM
Category: