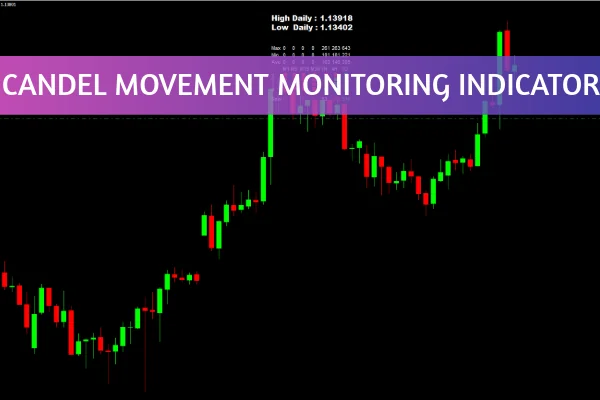
The Candle Movement Monitoring Indicator for MT4 is a powerful forex trading tool designed to give traders detailed insights into candlestick and price movement behavior. By displaying key data such as maximum, minimum, and average pip movements across different timeframes, this indicator enables traders to assess volatility and candle dynamics quickly.
Unlike standard MT4 indicators that focus only on price direction, this tool provides a deeper look into how far candles move on each timeframe — from M1 (1 minute) to D1 (1 day). This makes it an ideal companion for scalpers, day traders, and swing traders alike.
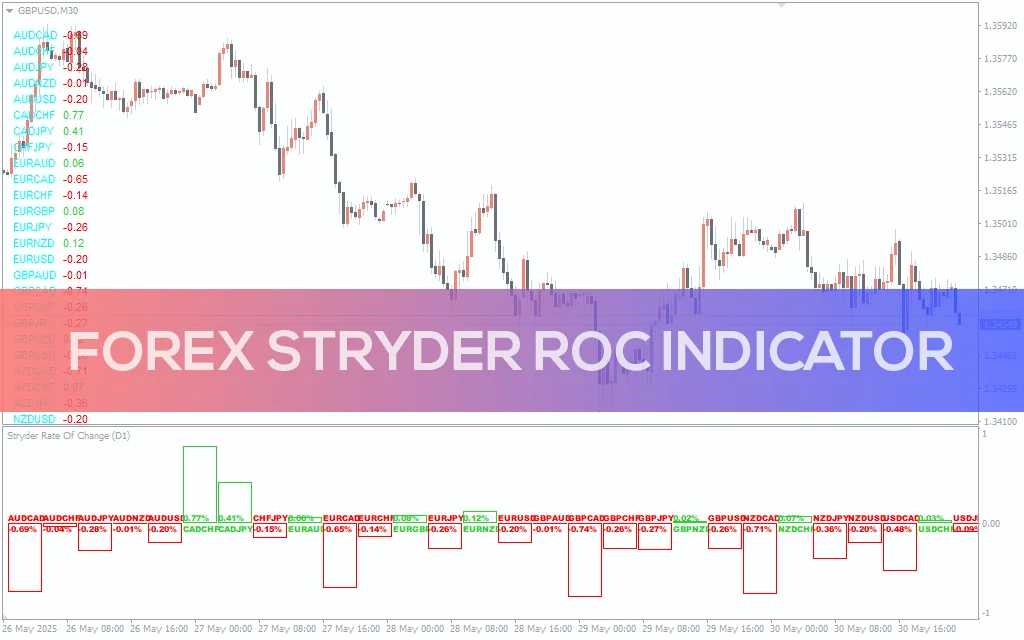
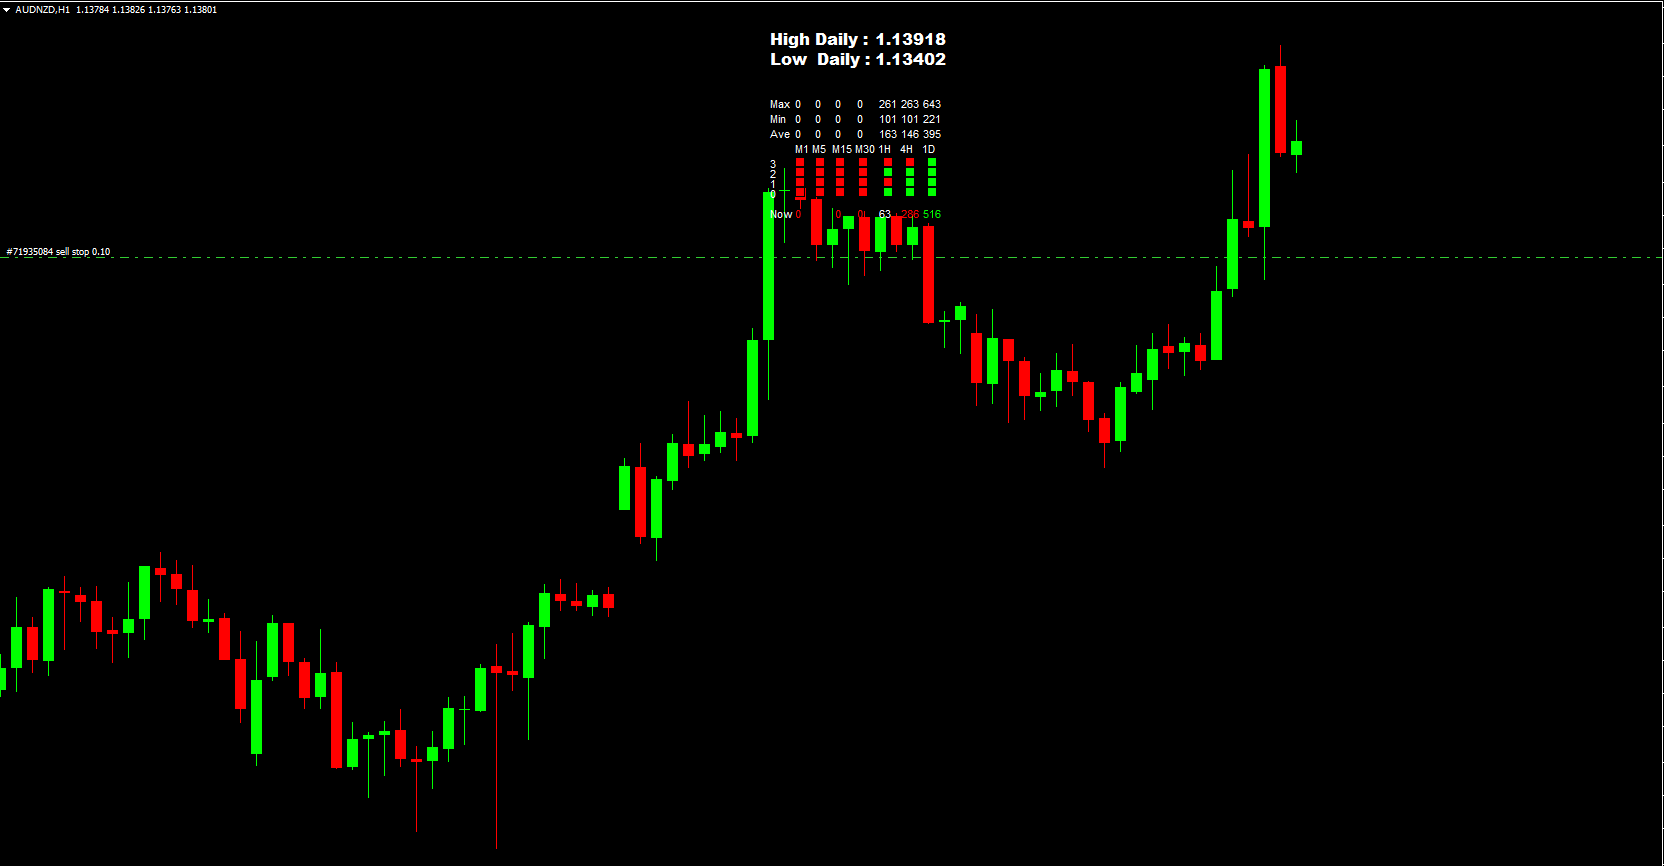
The indicator showcases comprehensive candlestick information across M1, M5, M15, M30, H1, H4, and D1 charts. It includes the maximum, minimum, and average pip movements for each timeframe, allowing traders to understand the range of price action at a glance.
A unique feature of the Candle Movement Monitoring Indicator for MT4 is its ability to show the direction of the current candle and the previous three candles. Each candle is color-coded — bullish candles appear in one color, bearish in another — making it simple to spot short-term momentum or trend reversals.
You can apply the indicator on any chart regardless of its timeframe. It automatically retrieves and displays information from all major periods (M1–D1), making it versatile and efficient for all trading strategies.
The indicator’s display is organized into multiple rows:
Top Row: Daily high and low prices.
Middle Rows: Maximum, minimum, and average pip movements for each timeframe.
Candle Rows (3, 2, 1, 0): Represent the bullish or bearish direction of the last three and the current candle.
Bottom Row: Current candle movement in pips.
This structured layout allows traders to interpret candle movements and volatility levels in seconds.
Attach the Indicator: Once installed, open your MT4 platform and add the indicator to your preferred chart.
Observe Candle Colors: Check the last four candles (0–3) to identify recent bullish or bearish momentum.
Analyze Pip Movements: Look at the maximum, minimum, and average pip values to measure volatility and determine potential entry/exit zones.
Combine with Strategy: Use the data alongside your trading system, such as moving averages, RSI, or support/resistance levels.
For instance, if the indicator shows increasing average pip movement across timeframes, it could signal growing market volatility — a valuable clue for breakout traders.
Enhances understanding of price volatility and candle strength.
Useful for scalpers and swing traders who rely on pip-based analysis.
Helps confirm market conditions before entering trades.
Saves time by presenting complex data in a clear, visual format.
While the Candle Movement Monitoring Indicator for MT4 is an excellent analytical tool, it does not provide direct buy or sell signals. Instead, it’s best used in conjunction with other technical indicators and price action strategies for optimal decision-making.
In summary, the Candle Movement Monitoring Indicator for MT4 equips traders with critical insights into candle behavior and pip movements across multiple timeframes. By understanding the underlying volatility and candle trends, traders can make more informed and confident trading decisions.
Visit IndicatorForest.com to download this and many other powerful MT4 and MT5 indicators that enhance your forex trading performance.
Published:
Oct 28, 2025 13:32 PM
Category: