The GRaB Candles Short Indicator (Green, Red, and Blue Candles) is a repainting technical analysis tool that helps traders identify market momentum and trend direction quickly. By color-coding candles and adding channel bands, this indicator visually highlights whether bulls or bears are in control.
This makes the GRaB Candles Short particularly effective for short-term trading, especially on 1-minute to 5-minute timeframes, where market volatility is high. Despite its repainting nature, it can offer powerful visual cues when used correctly.
How GRaB Candles Short Works
The indicator relies on color-changing candles and three dynamic bands to show the trend direction:
Green Candles: Signal bullish momentum (buy opportunity).
Red Candles: Signal bearish momentum (sell opportunity).
Blue/White Candles: Indicate neutral or sideways market conditions.
In addition to these candles, the three bands act as a dynamic channel, showing potential Support And Resistance zones. When the price is above the bands, the market is in an uptrend; when it’s below, a downtrend is confirmed.
How to Use the GRaB Candles Short Indicator
Buy Signal Setup
A buy signal occurs when:
The candle turns green, showing bullish control.
The bands slope upward, confirming a rising trend.
The Price Action stays above the upper band.
This combination suggests that buying pressure is strong and a bullish momentum is likely to continue.
Sell Signal Setup
A sell signal occurs when:
The candle turns red, signaling bearish momentum.
The bands slope downward, showing a falling trend.
The price action moves below the lower band.
This alignment indicates sellers are dominating, and a short position may be ideal.
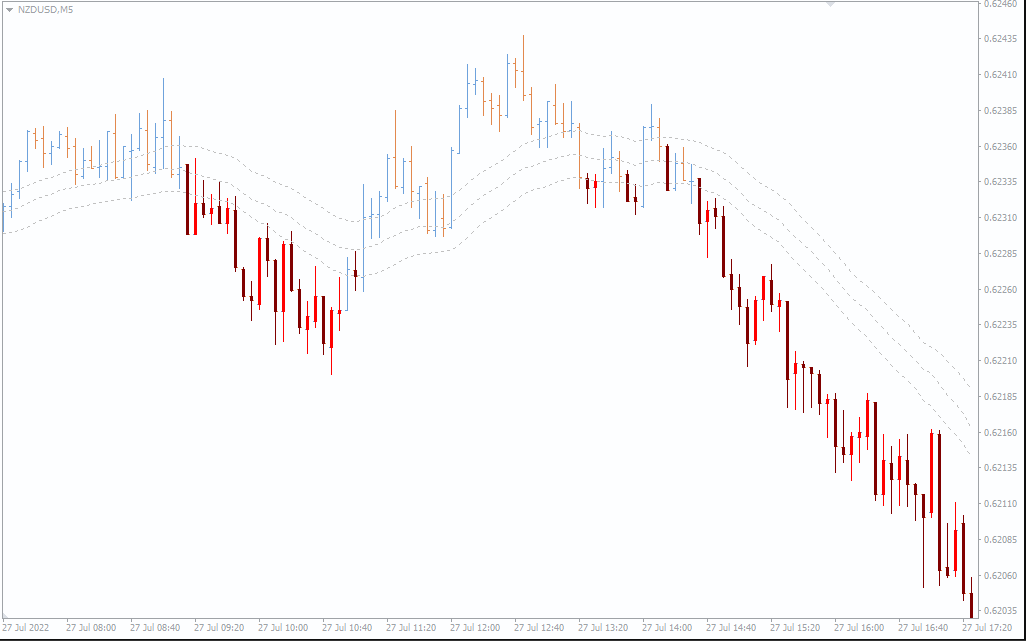
Example of GRaB Candles Short in Action
Let’s look at a five-minute chart example. During a short rally, the GRaB indicator might show empty green bars, meaning weak momentum. When candles turn white or blue, it’s a sign of market indecision — traders should stay out.
As the market shifts, red candles begin forming while the bands slope downward, confirming bearish momentum. The continuous downward slope of the channel bands acts as dynamic resistance, with price staying below them during the downtrend.
The end of the trend happens when candles turn green again and the bands start sloping upward, signaling a bullish reversal.
Tips for Trading with GRaB Candles Short
Use it with trend-confirming indicators like Moving Average or MACD for higher accuracy.
Avoid trading during low-volume or sideways markets (when white or blue candles appear).
Combine it with price action analysis to confirm entries and exits.
Always test the indicator on a demo account before using it live.
Why Use GRaB Candles Short Indicator
The GRaB Candles Short Indicator MT4 is ideal for traders who prefer visual confirmation of trends. Its simplicity and multi-layered channel system help traders spot potential reversals and strong trends early.
If you are a scalper or day trader, this indicator can be an essential part of your technical toolkit. Despite its repainting nature, it’s effective when used with patience and proper confirmation signals.
Conclusion
The GRaB Candles Short Indicator is a powerful visual tool that simplifies market analysis using color-coded candles and channel bands. By understanding how to read its signals, traders can better identify trend reversals, momentum shifts, and entry or exit points.
Enhance your trading experience today by downloading and exploring this indicator on IndicatorForest.com — your trusted source for free and premium MT4/MT5 indicators
6 Downloads
Published:
Oct 31, 2025 15:20 PM
Category: