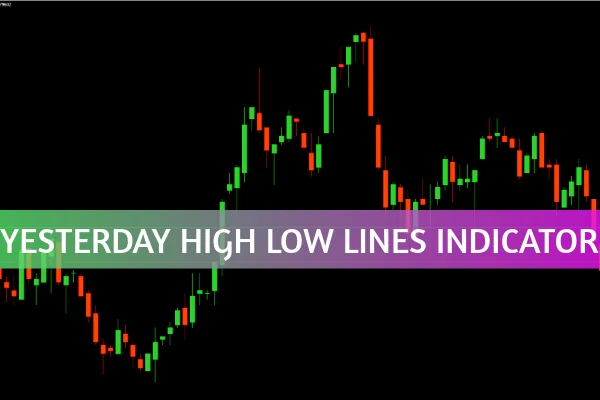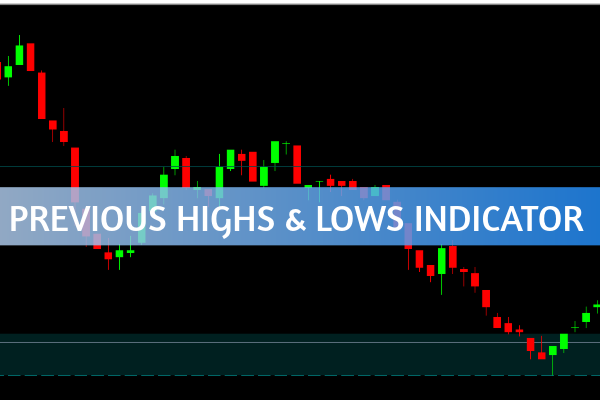
The Previous Highs & Lows Indicator for MT4 is a lightweight yet highly effective tool designed to automatically plot historical high and low price levels directly on your MetaTrader 4 chart. These levels act as vital reference points for traders using breakout, pullback, or mean reversion strategies.

By displaying previous highs and lows with precision, this indicator gives traders a clear view of potential support and resistance zones. Whether you’re a scalper, day trader, or swing trader, the Previous Highs & Lows Indicator enhances your market awareness and improves the accuracy of trade entries and exits.
This indicator functions as an automatic price map, drawing lines or shaded areas to highlight where price previously reversed or consolidated. These levels serve as high-probability reaction zones where institutional traders often make decisions.
For example:
When the price nears a previous high, it may act as resistance, creating a potential short opportunity.
If the price breaks above a previous high and then retests it as support, it signals a possible bullish continuation.
Similarly, previous lows can indicate support levels where the price may rebound or reverse.
By visualizing these key areas, traders can quickly identify entry, stop-loss, and take-profit levels without cluttering their charts with multiple indicators.
Manual plotting of highs and lows can be time-consuming and prone to error. This indicator automates that process, ensuring every crucial level is marked instantly and accurately.
Whether you prefer breakout trading, range trading, or reversal setups, this indicator supports them all. It highlights potential turning points and helps confirm market structure, offering traders a clear roadmap of price behavior.
Unlike many MT4 indicators that clutter the chart, the Previous Highs & Lows Indicator maintains a clean visual layout. It’s optimized for performance, meaning it runs smoothly even on multiple currency pairs simultaneously.
From beginners learning the basics of market structure to professionals refining advanced trading strategies, this tool adapts to every trading style and skill level.
Breakout Confirmation:
Watch how price reacts around previous highs or lows. A breakout followed by a retest often indicates a strong continuation move.
Support and Resistance Trading:
Combine previous highs and lows with candlestick patterns to spot precise entry points for reversals or rejections.
Mean Reversion Strategy:
In range-bound markets, when price moves between previous highs and lows, traders can use these zones for buying low and selling high.
Stop-Loss and Take-Profit Planning:
Use previous lows as logical stop-loss levels for buy trades and previous highs for take-profit targets — and vice versa.
Automatically identifies strong support and resistance levels
Enhances precision in breakout and reversal trades
Clean interface for easy chart reading
Works seamlessly across all MT4 instruments
Doesn’t generate direct buy/sell signals
Works best when combined with trend or volume indicators
May require visual confirmation during high-volatility periods
Despite these limitations, the Previous Highs & Lows Indicator provides an unmatched advantage in identifying key market reaction zones — an essential part of any trader’s toolkit.
The Previous Highs & Lows Indicator for MetaTrader 4 is an invaluable resource for traders seeking clarity and accuracy in their market analysis. By automatically marking past highs and lows, it simplifies the process of identifying support and resistance zones, saving time and improving decision-making.
Whether you’re planning a breakout trade or preparing to catch a rejection at a key level, this indicator ensures that your charts are always equipped with vital market context.
👉 Download the Previous Highs & Lows Indicator today from IndicatorForest.com and take your trading precision to the next level.
Published:
Oct 28, 2025 12:31 PM
Category: