Unlock Market Hidden Strength with the ASI Indicator for MT4
In the pursuit of professional technical analysis, Price Action alone often fails to tell the complete story of market dynamics. While standard charts track the open, high, low, and close, they frequently ignore the subtle interplay of momentum and volatility that signals a genuine breakout. The ASI Indicator (Accumulative Swing Index) for MetaTrader 4 (MT4) is a definitive solution to this problem. Developed as a professional-grade technical tool, the ASI distills complex price fluctuations into a single, cohesive line that reveals the market's "true" swing.
The Science of the Accumulative Swing Index
The ASI is a cumulative total of the Swing Index, a mathematical formula designed to identify the real strength behind price movements. While a standard price chart can be influenced by erratic "noise" and false spikes, the ASI uses a sophisticated calculation that compares current price action with the previous session's data. This results in a signal line that mirrors price movement but provides a smoother, more reliable representation of the market's actual directional intent.
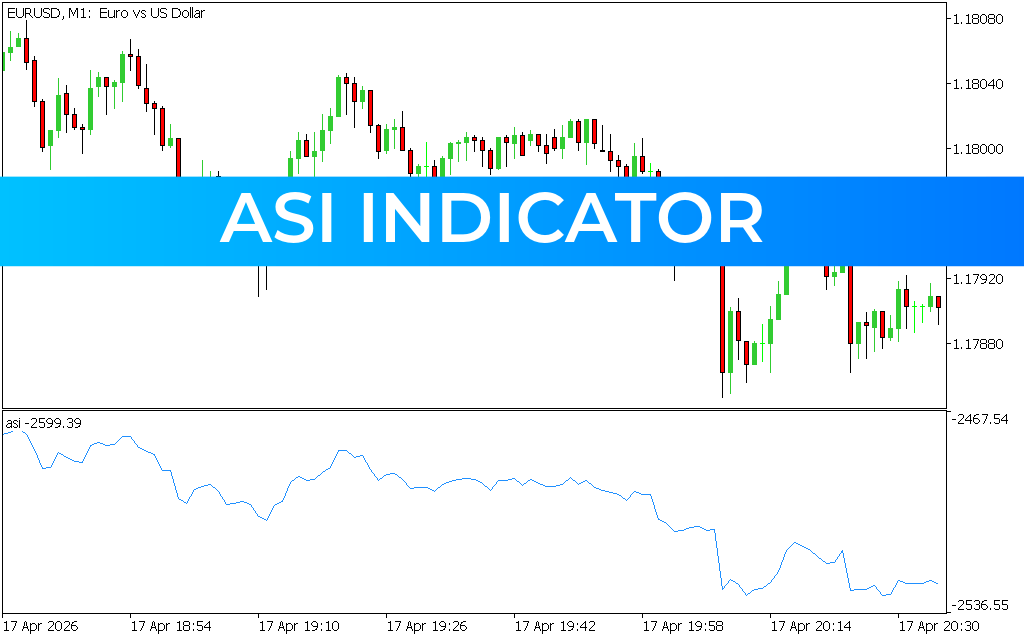
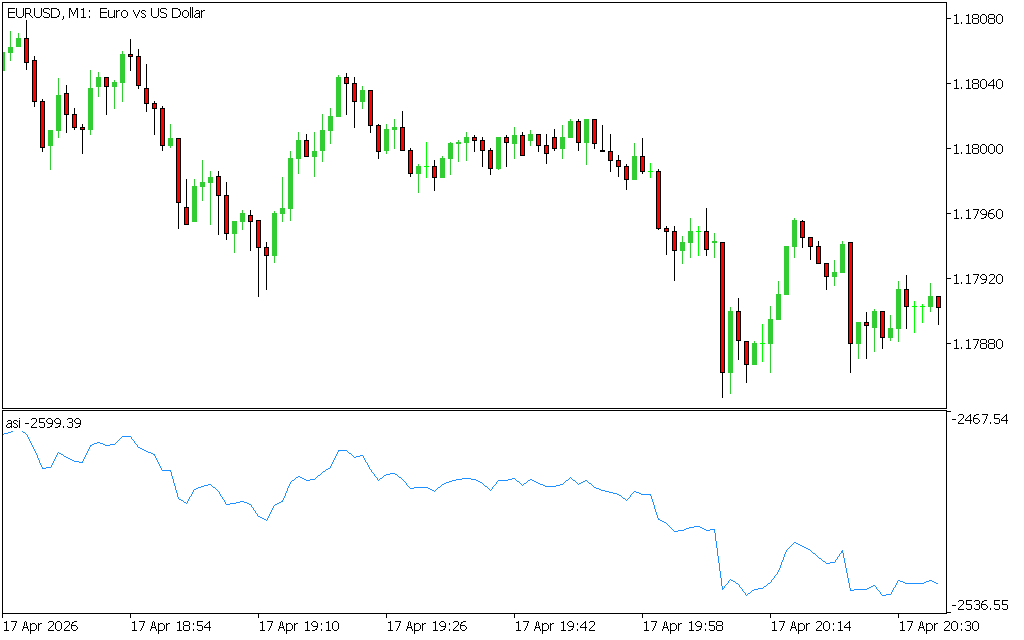
As demonstrated in technical analysis on liquid pairs like EUR/USD on the M1 timeframe, the ASI system offers several definitive operational advantages:
- Surgical Trend Confirmation: The ASI is an essential asset for verifying the validity of a trend. As seen on recent M1 charts, when the ASI line breaks above a previous peak, it provides professional-grade confirmation that a bullish trend is intact. Conversely, a break below a prior trough signals a definitive shift toward bearish pressure.
- Precision Breakout Validation: One of the greatest challenges for intraday traders is the "fakeout." The ASI solves this by acting as a filter. If price breaks a resistance level but the ASI fails to reach a new high, the breakout lacks institutional backing. When both price and the ASI break out simultaneously, the probability of a successful expansion increases exponentially.
- Leading Divergence Identification: The ASI is world-class at spotting market exhaustion. If price makes a new high but the ASI produces a lower peak, it provides a grounded warning of a "hidden" momentum decay. This allows traders to exit positions before a major reversal occurs.
- Objective Support And Resistance: Unlike subjective trendlines drawn on a price chart, the ASI allows traders to draw levels directly on the indicator line. These "ASI trendlines" often break before price trendlines, providing a leading signal for strategic entries.
Strategic implementation for Systematic Success
The ASI Indicator is a professional-grade tool for traders who value a disciplined, data-driven approach.
- The Trendline Break Strategy: Draw trendlines on the ASI sub-window. A break of an ASI trendline often precedes a significant move in price, offering a definitive edge for early entries.
- Confirmation of "Real" Price: Use the ASI to determine the "true" price of an asset. By focusing on the cumulative swing rather than raw candle closes, you stay aligned with the dominant market cycle.
- Intraday Scalping Synergy: Align the ASI on the M1 with higher-timeframe trends. When the ASI shows a strong slope on the 1-minute chart in the direction of the hourly trend, it identifies high-fidelity scalping opportunities.
Conclusion
The ASI Indicator for MT4 is a definitive solution for traders who demand institutional-grade clarity. By bridging the gap between raw price action and the underlying strength of the market, it empowers you to navigate the financial landscape with grounded, professional confidence. Elevate your technical analysis today and master the true swing of the market with the ASI system.
1 Download
Last Update:
Apr 18, 2026 22:46 PM
Published:
Feb 04, 2026 13:46 PM
Category: