Master Market Momentum with the Normalized Volume Indicator
In the world of technical analysis, volume is often described as the fuel that powers price movement. However, raw volume data can be erratic and difficult to interpret across different trading sessions or financial instruments. To solve this, professional traders turn to the Normalized Volume Indicator, a powerful tool designed to bring mathematical consistency to market activity analysis.
What is the Normalized Volume Indicator?
The Normalized Volume Indicator is a sophisticated technical analysis tool that transforms standard volume data into a readable, percentage-based oscillator. By "normalizing" the data, it compares current trading activity against a historical average. This allows traders to identify whether current market participation is exceptionally high, average, or dangerously low, regardless of the asset being traded.
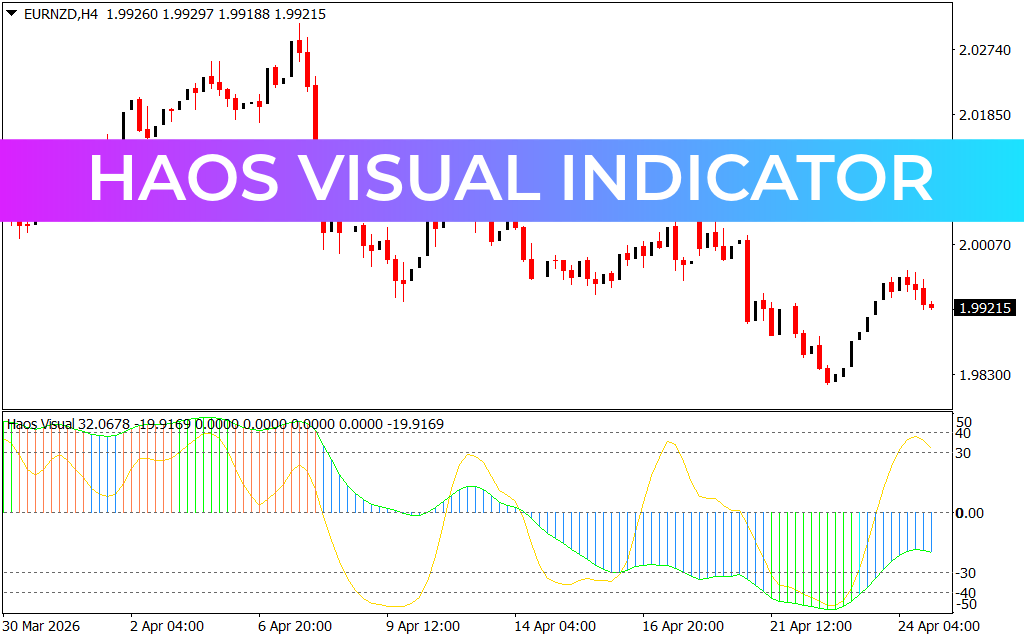
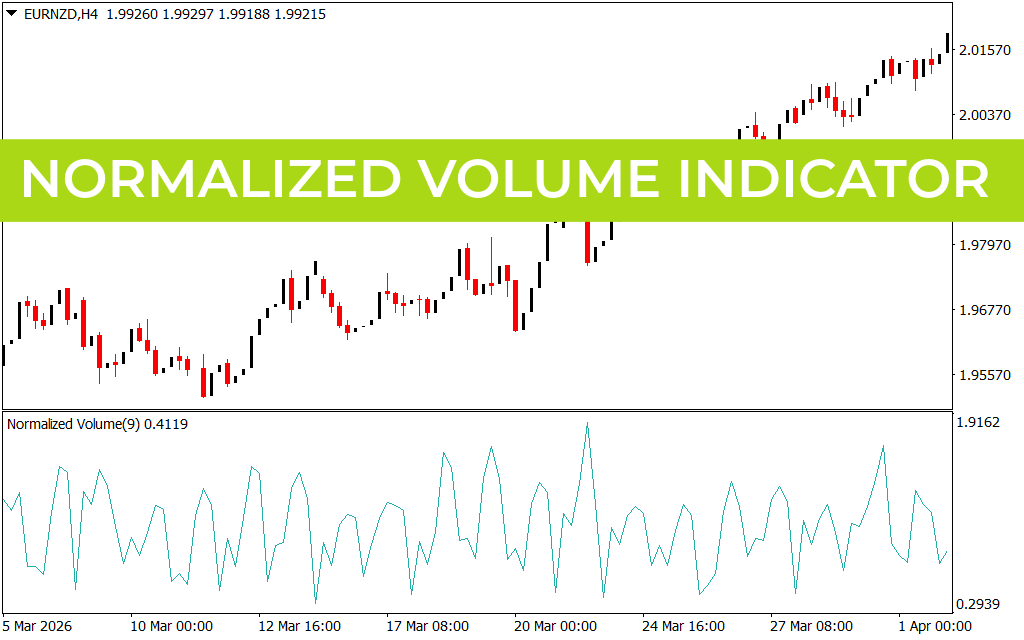
As seen in the EURNZD H4 chart, the indicator appears as a sharp, rhythmic oscillator in a sub-window. Instead of seeing raw numbers of contracts or lots, the trader sees peaks and troughs that represent relative market intensity.
Why Normalization Matters for Traders
Standard volume bars often fail to account for time-of-day volatility. For example, volume during the London-New York overlap is naturally higher than during the Asian session. A standard volume bar might look "big" simply because of the time, whereas the Normalized Volume Indicator adjusts for these cycles. It highlights true surges in interest, helping you distinguish between a genuine trend breakout and a low-liquidity "fakeout."
Key Benefits of Using Normalized Volume
- Identifying Institutional Activity: Significant spikes in normalized volume often indicate "Smart Money" entering the market. When volume exceeds the normalized baseline during a price breakout, it confirms the strength of the move.
- Spotting Trend Exhaustion: If the price continues to make new highs while the Normalized Volume Indicator shows declining peaks (divergence), it is a classic warning sign that the trend is losing steam and a reversal may be imminent.
- Improved Entry Timing: By waiting for a volume "surge" to accompany a technical signal, traders can significantly increase their win rate. It ensures you are trading with the momentum, not against it.
- Volatility Filter: In quiet markets where the indicator remains flat at its lower bounds, it signals a period of consolidation. This tells disciplined traders to stay on the sidelines until liquidity returns.
Strategic Application
For maximum effectiveness, the Normalized Volume Indicator should be paired with Price Action or trend-following tools. When the indicator peaks at a major resistance level, it suggests a high-probability rejection. Conversely, a sustained climb in normalized volume during a steady uptrend confirms healthy buying pressure.
By integrating this indicator into your MetaTrader setup, you move beyond simply watching price and begin understanding the intensity behind every candle. It is an essential upgrade for any trader looking to achieve institutional-level market insight.
1 Download
Last Update:
Apr 25, 2026 22:27 PM
Published:
Feb 02, 2026 14:19 PM
Category: