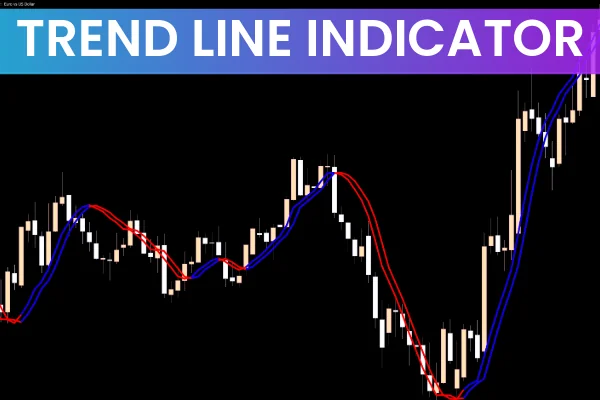
The Trendline Indicator for MT5 is a powerful automatic trend analysis tool that uses a Least Squares Moving Average (LSMA) to draw dynamic trendlines—rather than traditional straight lines. This allows traders to identify the true underlying trend, real-time Support And Resistance zones, and optimal entry levels with far greater precision.
By filtering out market noise, the indicator becomes highly effective for evaluating trade setups, validating chart patterns, and timing entries that align with the dominant trend. Whether you’re trading forex, stocks, futures, or cryptocurrencies, this MT5 trendline indicator provides a clear and adaptive Market Structure.
Key Features of the Trendline Indicator MT5
LSMA-based dynamic trendlines
Offers more accuracy than manually drawn trendlines.
Automatic trend direction detection
Blue for bullish trend, red for bearish trend.
Dynamic support and resistance levels
Helps traders spot high-probability reversal or continuation setups.
Non-repainting indicator
Ensures stable and reliable trendline signals.
Ideal for manual trading or EA integration
EAs can use the trendline areas as precise trigger zones.
How to Trade with the Trendline Indicator
The Trendline Indicator plots two LSMA-based lines that automatically change color to reflect trend direction:
Blue Lines → Bullish trend
Red Lines → Bearish trend
Identify the Current Trend
Before taking any trade, determine whether the trendline is blue or red.
Blue = look for buying opportunities
Red = look for selling opportunities
Wait for Price Action Near the Trendline
The trendline serves as dynamic support or resistance. Traders should wait for price to approach or touch the line before entering positions.
Look for a Confirming Signal
Valid price action signals include:
Breakouts
False breakouts
Pin bars
Engulfing candles
Triangle/pattern confirmations
A signal must occur near the trendline and must align with the trend direction.
Example of a Sell Setup
In the sample scenario:
Price breaks below the trendline support.
The indicator turns red, confirming a bearish shift.
Price attempts to climb back above the trendline but fails.
This creates a perfect sell setup:
Trend direction = bearish
Price rejection at dynamic resistance
Confirming price action
This alignment increases the probability of a profitable short trade.
Important Trading Rules
To maximize accuracy when using the Trendline Indicator:
Price action signals must form near the trendline
Signals that occur far from the trendline are less reliable.
Signals must align with the overall trend
Only buy if the trendline is blue
Only sell if the trendline is red
Avoid taking a trade if the candle pattern moves against the trend direction.
Conclusion
The Trendline Indicator MT5 is an excellent tool for identifying dynamic market structure through LSMA-based trendlines. It helps traders spot true support and resistance levels, improve trade confirmation, and align their strategies with the dominant market trend.
Although it is most commonly used in forex trading, the indicator performs equally well on stocks, futures, indices, and cryptocurrency charts.
You can download the Trendline Indicator for MT5 for free on our website and start enhancing your market analysis today.
FAQ
23 Downloads
Published:
Nov 16, 2025 12:12 PM
Category: