Master Price Psychology with the Sweet Spots Indicator for MT4
In the world of professional trading, Price Action is rarely random. Institutional players, banks, and hedge funds often focus their orders around specific psychological levels—large, round numbers where liquidity tends to cluster. These levels, known as "Sweet Spots," act as invisible magnets for price, serving as critical zones for trend reversals or explosive breakouts. The Sweet Spots Indicator for MetaTrader 4 (MT4) is a professional-grade tool designed to automatically map these psychological tiers, giving retail traders a definitive edge in understanding institutional Market Structure.
The Psychology of Round Numbers
Human psychology naturally gravitates toward simplicity. In financial markets, this manifests as a heavy concentration of buy and sell orders at round price levels (e.g., 1.1000, 1.1050, or 1.1100). Because so many market participants place their entries, take-profits, and stop-losses at these levels, price frequently reacts with surgical precision when it encounters them.
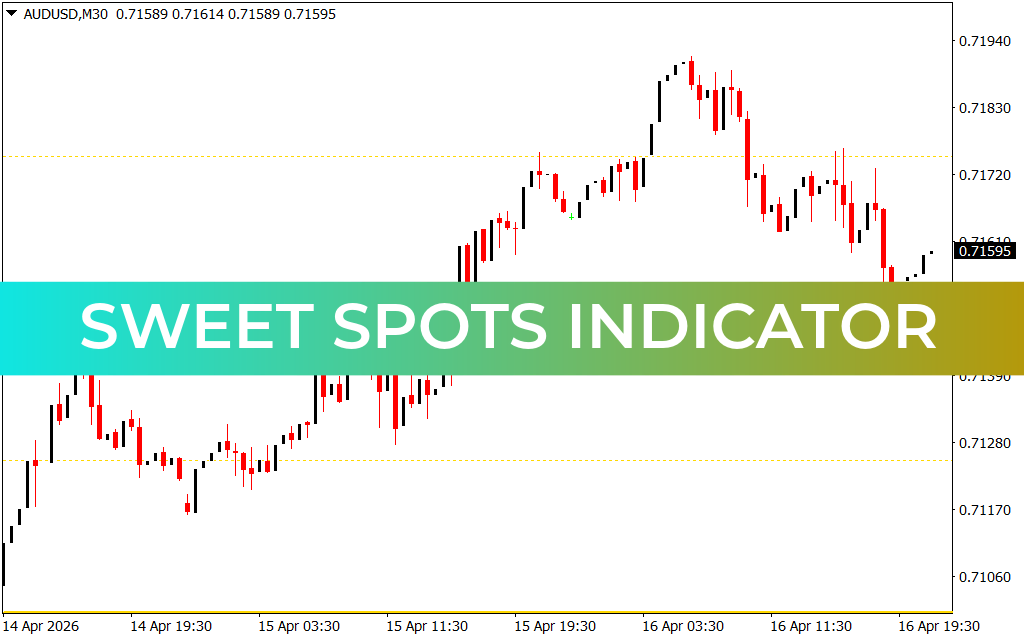
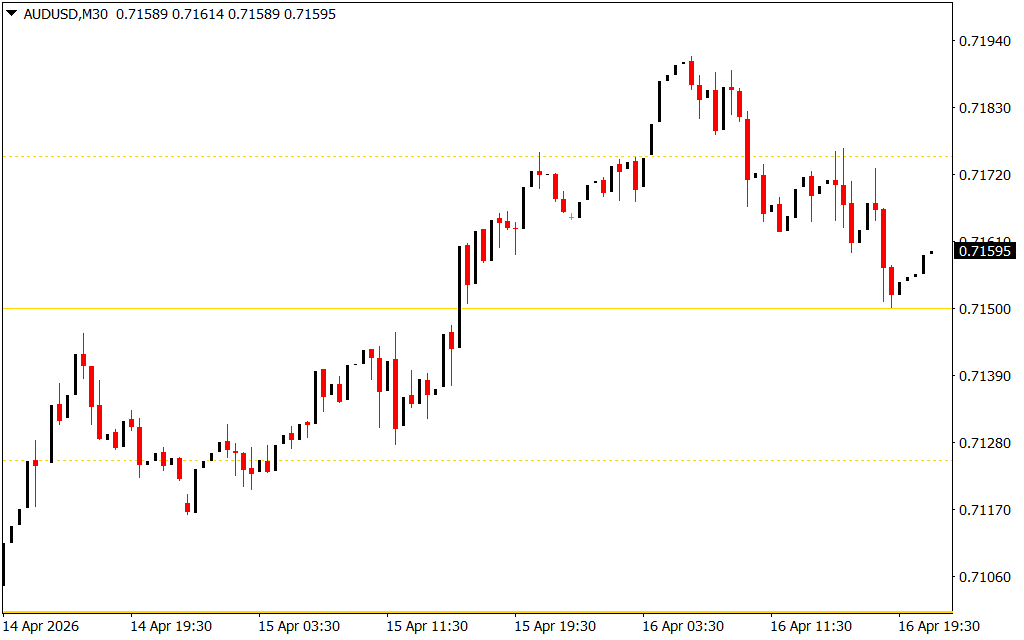
As demonstrated in the technical analysis of the AUD/USD M30 timeframe, the Sweet Spots system provides a clear, grid-based roadmap:
- Major Psychological Levels: The indicator plots prominent horizontal lines (often represented by solid lines) at "Big Figure" levels. These are the primary zones where major trend shifts are likely to occur.
- Minor "Half" Levels: Between the major figures, the indicator identifies secondary levels (often dashed lines) at 50-pip intervals. These serve as intraday targets and areas for "scaling in" to positions.
- Institutional Liquidity Zones: By highlighting these levels, the indicator reveals where the "smart money" is positioned. Price consolidation around a Sweet Spot often precedes a high-velocity expansion.
- Dynamic Support And Resistance: Unlike traditional indicators that lag behind price, Sweet Spots provide predictive support and resistance. Traders can anticipate where price will stall or bounce before it even reaches the level.
Strategic Advantages for Professional Execution
The Sweet Spots Indicator is an essential asset for any trader who values structural clarity and rule-based trading.
- Objective Target Setting: Stop guessing where to take profits. By using psychological round numbers, you align your targets with the natural flow of institutional liquidity.
- Surgical Entry Precision: Sweet Spots offer high-confluence entry points. When a price action signal (like a pin bar or engulfing candle) forms exactly on a round number, the probability of a successful trade increases exponentially.
- Enhanced Risk Management: Round numbers provide logical "fail-safes." Placing stop-losses just beyond a major psychological level ensures your trade is protected by a significant barrier of institutional orders.
- Universal Asset Coverage: Whether you trade Forex majors, Gold (XAUUSD), or Global Indices, the Sweet Spots algorithm automatically calculates the relevant round numbers for any instrument and timeframe.
Conclusion
The Sweet Spots Indicator for MT4 is a definitive tool for the modern technical analyst. By bridging the gap between raw price action and institutional psychology, it empowers you to navigate the markets with unparalleled confidence. Elevate your MT4 terminal today and start trading at the levels that truly matter with Sweet Spots.
4 Downloads
Last Update:
Apr 17, 2026 00:53 AM
Published:
Feb 09, 2026 21:51 PM
Category: