The Gann Levels Indicator for MT4 is a sophisticated trading tool based on W.D. Gann’s legendary methodologies. It visually plots significant price levels, helping traders identify support, resistance, and trend reversal zones. By combining geometry, mathematics, and market psychology, the Gann Levels Indicator simplifies complex price structures—making it easier for traders to interpret chart dynamics and plan accurate entries and exits.
Whether you’re a beginner learning Market Structure or a seasoned trader refining your strategy, the Gann Levels Indicator offers clarity, consistency, and control in analyzing Price Action.
How the Gann Levels Indicator Works
Geometric and Mathematical Precision
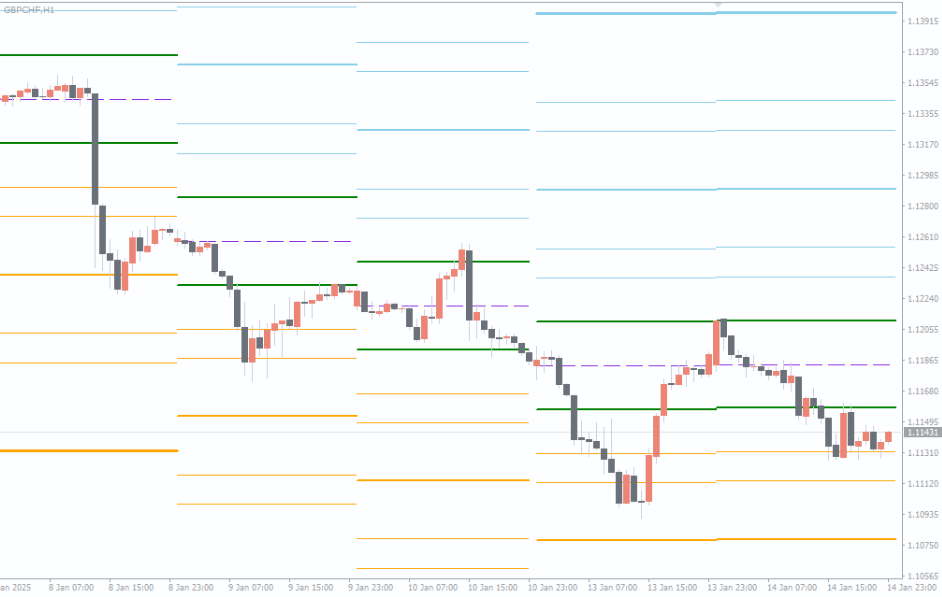
At its core, the Gann Levels Indicator applies geometric principles derived from W.D. Gann’s research on cyclical price behavior. It automatically calculates key horizontal levels where price tends to react—either bouncing off or breaking through. These zones often correspond to psychological barriers in the market.
Real-Time Support and Resistance Mapping
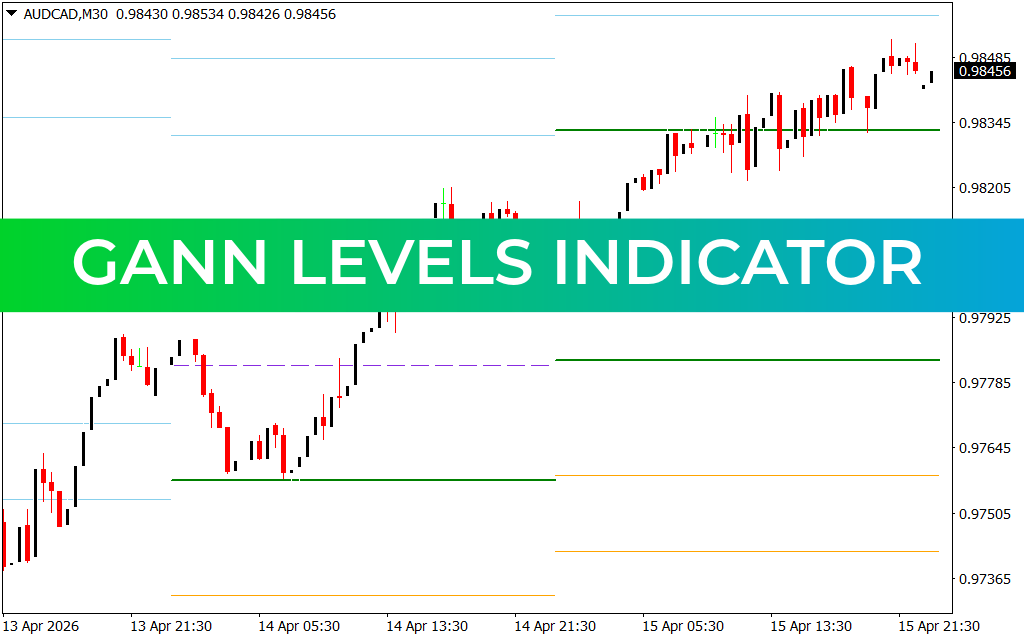
Once attached to an MT4 chart, the indicator instantly plots multiple Gann levels, revealing market equilibrium zones. These act as predictive guideposts for potential Support And Resistance reactions. Traders can quickly recognize strong confluence areas without manual analysis.
Practical Application for All Styles
The Gann Levels Indicator is highly flexible and works efficiently across various timeframes—from intraday setups (M15, H1) to longer-term swing trading (H4, D1). Its auto-adjusting nature allows seamless integration with existing strategies and minimal configuration.
Why Use the Gann Levels Indicator for MT4
Benefits
Accurate price level plotting based on proven Gann theories
Works across all currency pairs and timeframes
Helps traders spot reversals and continuation zones early
User-friendly interface with minimal settings
Compatible with other Gann-based tools for enhanced analysis
Limitations
It’s primarily a visual indicator, not a signal generator
Effectiveness depends on correct anchor point selection
Best results occur when combined with price action confirmation
Practical Example: Trading with Gann Levels
When price approaches a Gann support level, traders can look for bullish candlestick patterns or volume confirmation before entering a long trade. Conversely, if the price breaks below a Gann resistance level, it may indicate a continuation of bearish momentum.
For instance, during backtesting on H4 charts, many users observed how these plotted zones accurately anticipated reversals, making it a valuable companion for both manual and automated systems.
Complementary Tools on IndicatorForest.com
To maximize results, pair this indicator with our Gann SQ9 (Square of 9) Indicator and Gann Made Easy Indicator. These tools enhance geometric visualization and precision, forming a powerful Gann-based toolkit.
Expert Tip: Combining Gann Levels with Trend Filters
For even greater accuracy, consider combining the Gann Levels Indicator with trend indicators like Moving Averages or RSI. Doing so helps confirm whether price is respecting or rejecting critical Gann zones—adding an extra layer of validation.
Pro Insight: Gann levels aren’t just lines; they represent mathematical symmetry in price behavior. Learning to interpret them properly can transform how you view the market.
Conclusion
The Gann Levels Indicator for MT4 is an indispensable asset for traders who want to bring mathematical discipline and precision to their market analysis. It simplifies identifying support, resistance, and trend reversals—key ingredients for consistent trading success.
Enhance your trading edge today by downloading the Gann Levels Indicator from IndicatorForest.com. Whether you’re trading forex, indices, or commodities, this indicator provides the structure and insight you need to make smarter decisions.
Frequently Asked Questions (FAQ)
Does the Gann Levels Indicator repaint?
No. Once plotted, the levels remain fixed, ensuring reliability across sessions.
Which timeframe works best?
It performs exceptionally well on H1, H4, and D1 charts.
Can it be used with EAs?
Yes, some Expert Advisors can read Gann levels, but manual confirmation is advised.
18 Downloads
Last Update:
Apr 16, 2026 02:56 AM
Published:
Feb 11, 2026 13:34 PM
Category: