The Tipu MACD Indicator for MT4 is an enhanced version of the classic MACD—Moving Average Convergence and Divergence—designed for clearer, more actionable trading signals. It displays visual bullish and bearish arrows, alert notifications, and improved histogram interpretation, making it easier for traders to identify trend changes. Whether you are a beginner exploring MACD-based strategies or an advanced trader refining your entry timing, the Tipu MACD Indicator for MT4 provides a clean and user-friendly technical solution.
This upgraded version maintains the core principles of the traditional MACD while adding features that help traders understand momentum more effectively. Since the indicator works across all timeframes and currency pairs, it remains a versatile tool for intraday, swing, and long-term trading.
What Is the Tipu MACD Indicator for MT4?
The Tipu MACD is built on the foundations of the standard MACD but includes:
Signal line cross arrows
Zero-line cross signals
Histogram color changes
Sound/popup alert notifications
Clear visualization for bullish and bearish trends
Its purpose is to simplify MACD interpretation and provide earlier, cleaner trade setups. The indicator is displayed in a separate window, making it easier to track alongside your price chart.
How the Tipu MACD Indicator for MT4 Works
The indicator analyzes two exponential moving averages (fast and slow EMAs) to identify momentum shifts. These shifts are displayed through:
Signal Line
Zero Line Crossovers
Directional Arrows
Histogram Color Signals
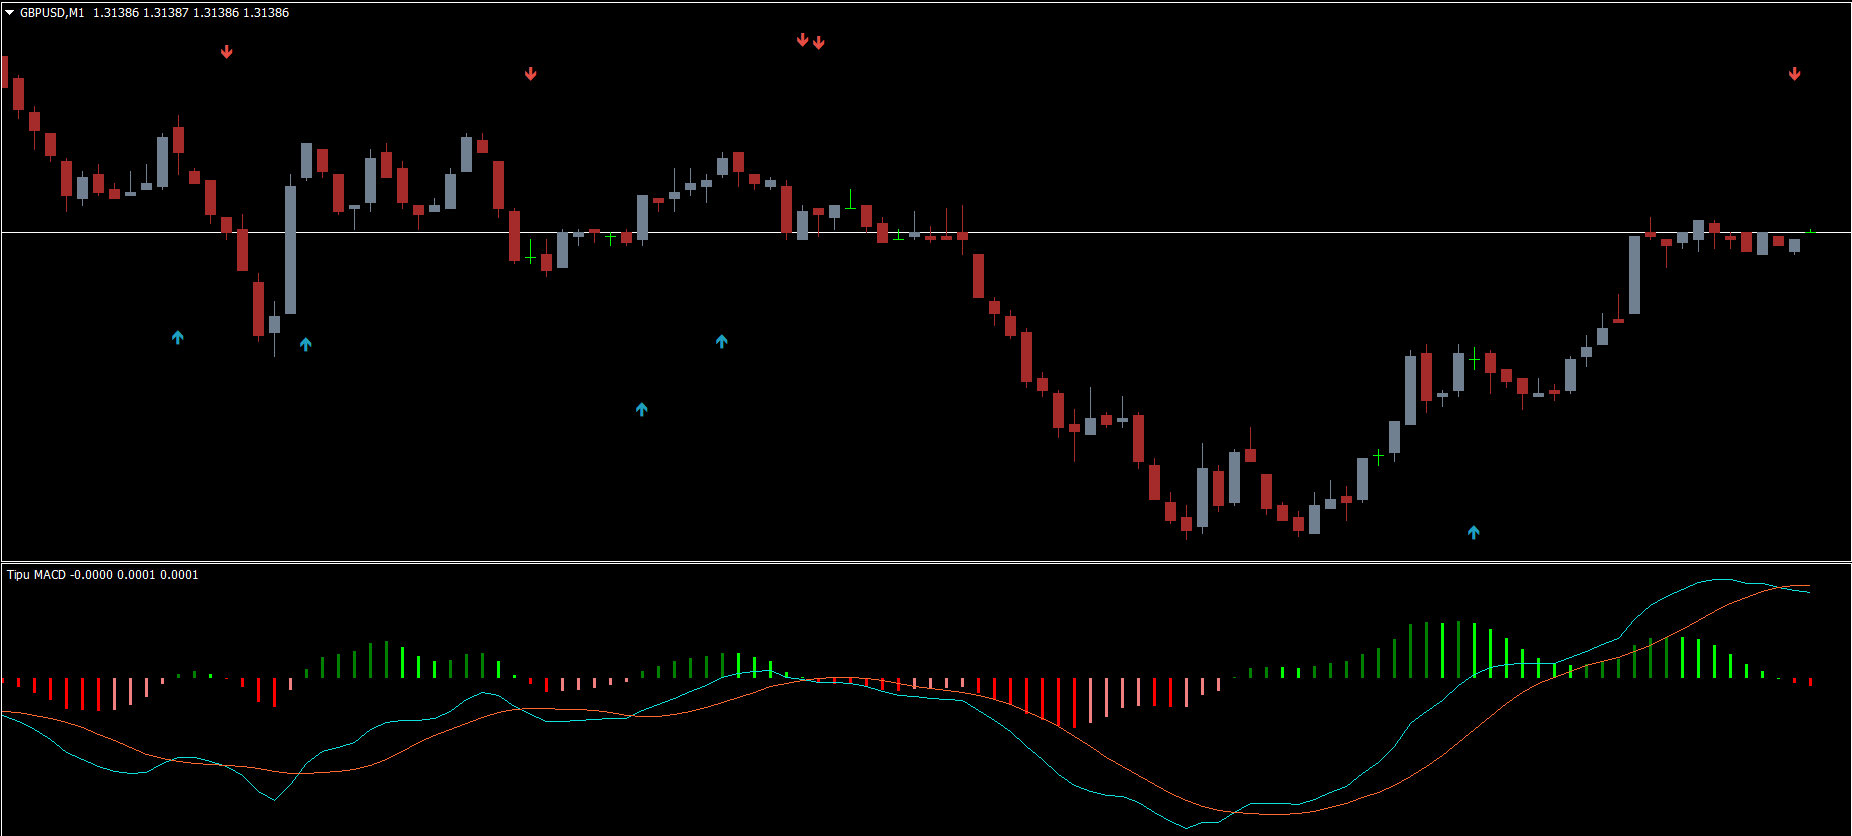
A unique feature of the Tipu MACD is its color-coded histogram:
Red Histogram → Buy Signal
Green Histogram → Sell Signal
Although opposite of traditional MACD colors, this version is optimized for early trend anticipation. When the histogram turns red, bullish momentum is increasing. When it turns green, bearish pressure is strengthening.
This helps traders react quickly while maintaining a favorable risk-to-reward ratio.
Tipu MACD Indicator for MT4 Trading Signals
The GBPUSD H4 chart example demonstrates how the Tipu MACD generates actionable signals.
Buy Signal
Triggered when the histogram turns red or when the MACD line crosses above the Signal line.
Trading approach:
Enter BUY on histogram red phase
Place stop loss below previous swing low
Exit when opposite signal appears or momentum weakens
Sell Signal
Triggered when the histogram turns green or when the MACD line crosses below the Signal line.
Trading approach:
Enter SELL on histogram green phase
Stop loss above recent swing high
Exit at opposite color change or when momentum slows
Zero Line Cross Strategy
Zero-line crossovers often indicate major trend shifts:
MACD crossing above zero → Bullish momentum
MACD crossing below zero → Bearish momentum
These signals are useful for medium-term trend trading and can complement moving averages or Price Action support/resistance levels.
Why Use the Tipu MACD Indicator for MT4?
The indicator is ideal for:
Traders who prefer visual and alert-based signals
Momentum and swing traders
Traders needing a refined version of the classic MACD
Multi-timeframe trend confirmation
Early entry strategies based on histogram shifts
Its simplicity makes it suitable for beginners, while its depth and accuracy appeal to professionals.
Best Tips for Using the Tipu MACD Indicator
Combine MACD signals with trendlines and support/resistance
Do not rely solely on histogram color—confirm with price structure
Avoid trading against strong higher-timeframe trends
Use zero-line crosses for large trend moves
Add moving averages for trend confirmation
Conclusion
The Tipu MACD Indicator for MT4 is a powerful, customizable, and improved version of the classic MACD. Its color-coded histogram, arrow signals, and alert notifications make trading decisions easier and clearer. While effective on its own, the best results come when combined with solid price action and additional technical tools. Traders can enhance their analysis and find precise entry points using this versatile indicator.
For more MT4 and MT5 indicators, expert advisors, and trading tools, visit IndicatorForest.com.
FAQ
3 Downloads
Published:
Nov 18, 2025 21:51 PM
Category: