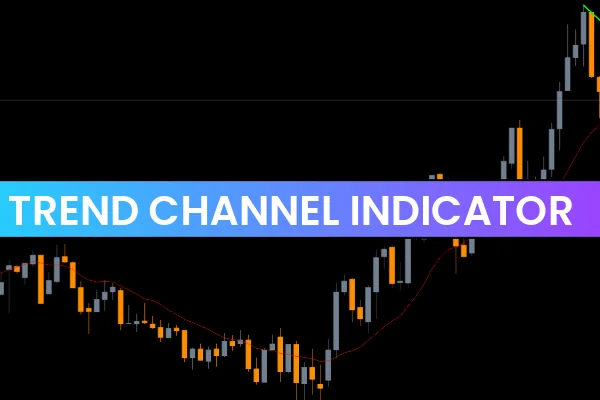
The Trend Channel Indicator automatically plots an upper and lower boundary around price, reflecting recent market highs and lows. These boundaries form a visual “price channel,” making it easier to identify whether the market is trending, consolidating, or preparing for a breakout.
Unlike static Support And Resistance lines, a Trend Channel adjusts dynamically as price evolves. This makes it highly valuable for short-term traders—especially scalpers and intraday traders—who rely on real-time price structure.
However, because the indicator continuously updates based on the latest price extremities, it is considered a repainting indicator. While this does not make it inaccurate, traders should understand that the channel lines may shift as new price data arrives.
How the Trend Channel Indicator Works
The indicator analyzes recent swing highs and swing lows, then draws:
Upper trendline: acts as dynamic resistance
Lower trendline: acts as dynamic support
The number of historical bars used to calculate these lines can be adjusted from the input settings. Traders can also customize colors, line thickness, and visual style depending on preference.
This flexibility allows the indicator to work on any currency pair and any timeframe, from 5-minute charts to daily and weekly charts.
How to Use the Trend Channel Indicator in Trading
Identifying Market Trend
If the channel is sloping downward, the market is bearish; if it slopes upward, the trend is bullish. In a sideways channel, price is consolidating.
Trading at the Channel Boundaries
When price approaches the upper channel line, traders often look for sell signals.
At the lower boundary, traders look for buy signals.
These levels act like dynamic support and resistance.
Waiting for Breakouts
A breakout above the upper channel or below the lower channel often signals strong momentum. In such cases:
A break above the channel suggests bullish continuation
A break below suggests bearish continuation
Breakouts can be validated using candlestick patterns, volume spikes, or additional indicators such as RSI or ATR.
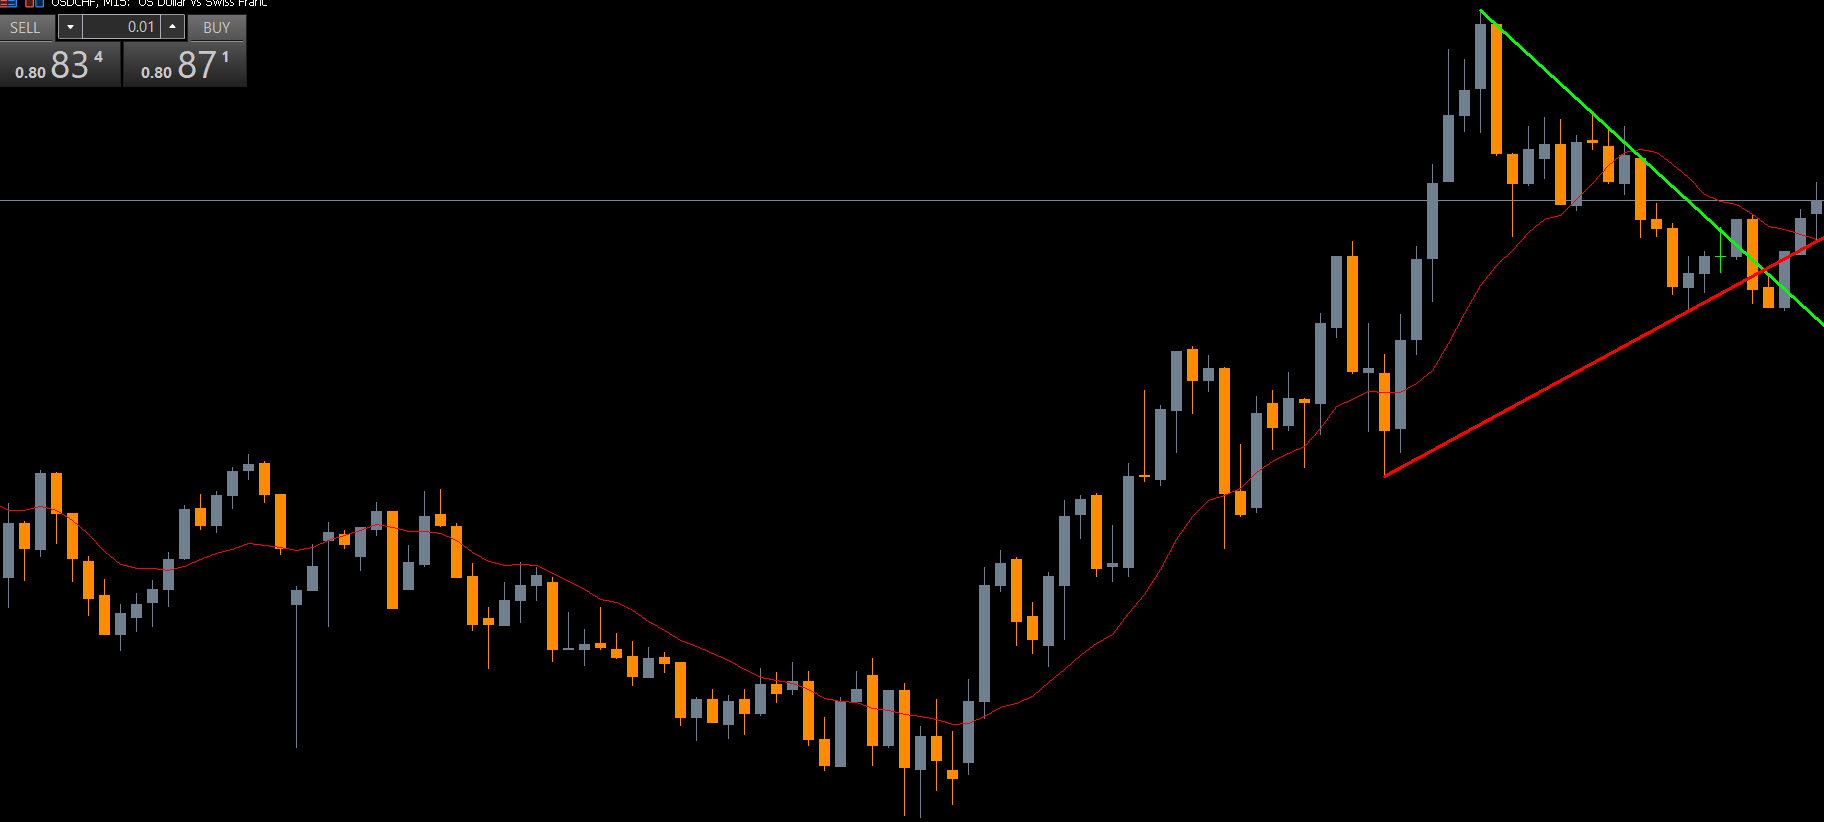
Chart Example Explanation
In the example chart of AUD/NZD, price is moving inside a downward channel. Traders can enter a SELL trade near the upper resistance line, place a stop loss around the most recent swing high, and set a take profit level at the channel’s lower support line.
However, price may break out of either boundary due to news events or high volatility. Therefore, traders often wait for price to reach the channel boundaries before entering a trade.
Advantages of the Trend Channel Indicator
Clear visual structure: Quickly identifies trend direction
Works in all market conditions
Highly customizable
Useful for both beginners and experts
Supports multiple trading styles (Scalping, intraday, swing)
Final Thoughts
The Trend Channel Indicator MT4 is a powerful tool that helps traders recognize key market levels, avoid poor entries, and take advantage of high-probability setups. While it may repaint, understanding its behavior and combining it with Price Action greatly improves accuracy.
For more MT4 indicators, expert tools, and downloadable resources, visit IndicatorForest.com and explore our growing library of premium-grade trading indicators.
FAQ
Published:
Nov 22, 2025 15:05 PM
Category: