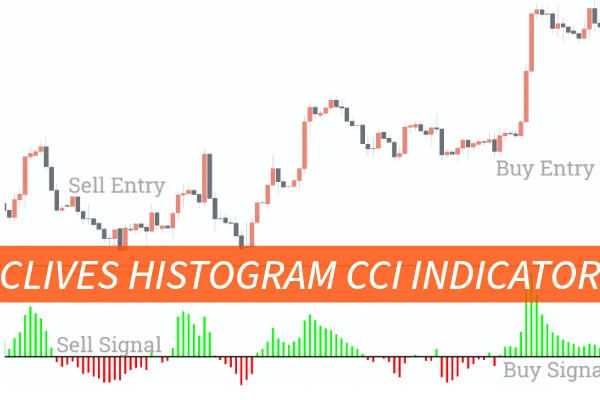
The Clives Histogram CCI Indicator for MT4 is a custom-built technical tool designed to enhance trend analysis and momentum detection. This indicator displays the Commodity Channel Index (CCI) as histogram bars, oscillating above and below the zero line to reflect positive and negative market zones.
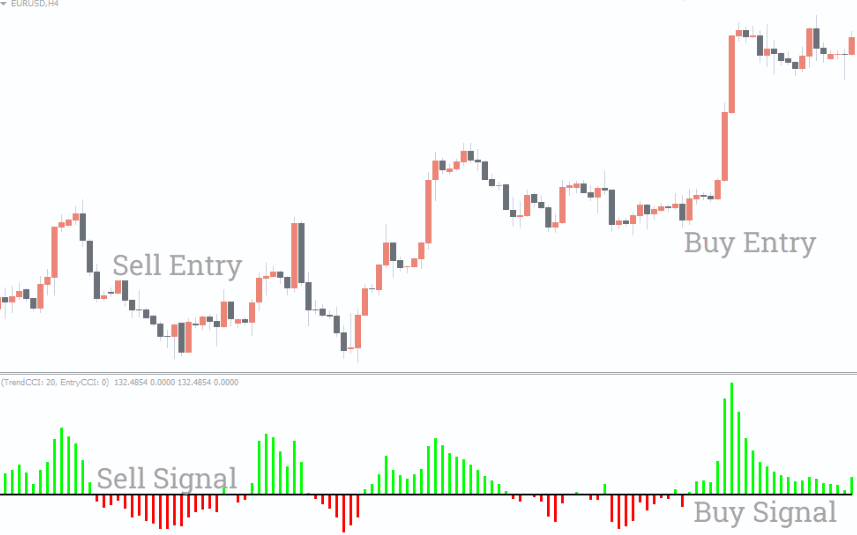
By visually mapping CCI movements, the indicator provides traders with a clear picture of market momentum — helping identify bullish and bearish trends. When the histogram rises above the zero line, it signifies a positive or bullish zone. Conversely, when it drops below the zero line, it highlights a negative or bearish zone.
At its core, the Clives Histogram CCI Indicator measures the difference between the CCI and its moving average.
Positive Zone: When the CCI crosses above the moving average, the histogram value becomes positive. This indicates strengthening bullish momentum and the potential start of an upward trend.
Negative Zone: When the CCI falls below the moving average, the histogram turns negative, signaling bearish momentum or a possible downward move.
This visual representation helps traders easily spot trend reversals and momentum shifts without relying on complex chart setups.
Simplified Trend Visualization
The histogram format makes it easy to read and interpret market direction at a glance, even for beginners.
Momentum Confirmation
Traders can confirm the strength of a trend by monitoring the histogram’s height and duration above or below the zero line.
Multi-Timeframe Analysis
The Clives Histogram CCI Indicator works seamlessly across all timeframes — from M1 to daily and weekly charts — offering flexibility for scalpers, day traders, and swing traders.
Early Reversal Detection
Because it measures the relationship between the CCI and its moving average, the indicator helps detect early signs of potential trend reversals before they appear in price action.
Add the Indicator to Your MT4 Chart
Once installed, open your MT4 platform, select “Insert → Indicators → Custom,” and choose Clives Histogram CCI.
Analyze Histogram Movements
When the histogram bars move from negative to positive, it may signal a buy opportunity.
When they move from positive to negative, it could indicate a sell setup.
Combine with Other Tools
Enhance accuracy by combining the Clives Histogram CCI Indicator with tools like moving averages, trendlines, or support and resistance levels for stronger confirmation signals.
Always confirm histogram signals with price action or another trend indicator.
Avoid trading in choppy or low-volume markets where false signals are more common.
Backtest the indicator on different assets and timeframes to find optimal settings for your strategy.
The Clives Histogram CCI Indicator for MT4 is a valuable tool for traders seeking clear visual confirmation of market momentum and potential trend reversals. By presenting the CCI as histogram bars, it simplifies complex market data into an easy-to-read visual format.
If you want to take your trading strategy to the next level, download the Clives Histogram CCI Indicator today at IndicatorForest.com and explore a wide range of professional-grade indicators designed for MT4 and MT5 platforms.
Published:
Oct 14, 2025 10:41 AM
Category: