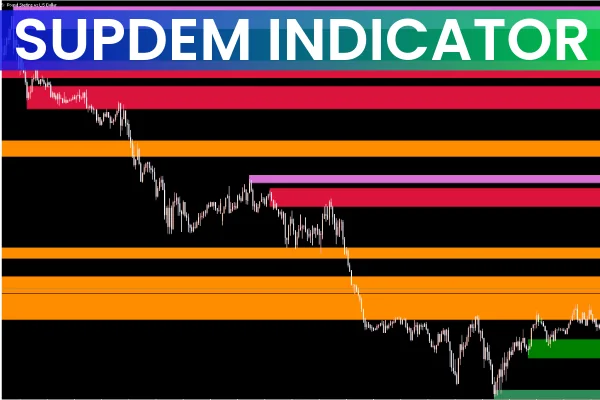
The SupDem Indicator for MT5 is a simple yet effective Market Structure indicator that highlights Supply And Demand zones—two of the most powerful concepts in technical analysis. “SupDem” is short for Supply and Demand, which represent areas where strong buying or selling pressure has previously influenced price movement.
These zones work similarly to traditional Support And Resistance levels, but with greater context, because they are drawn based on significant volume and volatility shifts. When the market reacts strongly at certain price levels, the SupDem Indicator marks them as potential reversal zones.
Green zones = Demand (possible bullish reversal)
Red zones = Supply (possible bearish reversal)
The indicator also includes additional trend hints, using red arrows and lines for bearish conditions and green arrows and lines for bullish conditions.
Because the SupDem Indicator does not generate direct buy or sell arrows, it’s best used together with other tools such as RSI, MACD, or Price Action signals.
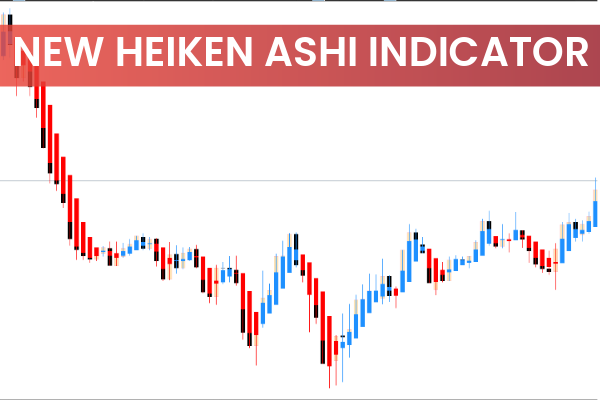
How the SupDem Indicator Works
SupDem automatically detects areas where the market showed strong reactions in the past—these areas become zones where price may reverse or pause in the future.
Demand Zone (Green)
Indicates a strong buying interest.
When price returns to this zone, a bullish reversal is possible.
Supply Zone (Red)
Indicates strong selling pressure.
When price revisits the zone, a bearish reversal may occur.
In addition, the indicator draws weaker supply/demand zones in lighter colors. These can still influence price but are less reliable. Traders should wait for confirmation when price interacts with these weaker zones.
The SupDem Indicator works well on all timeframes, but higher timeframes typically provide stronger, more reliable zones.
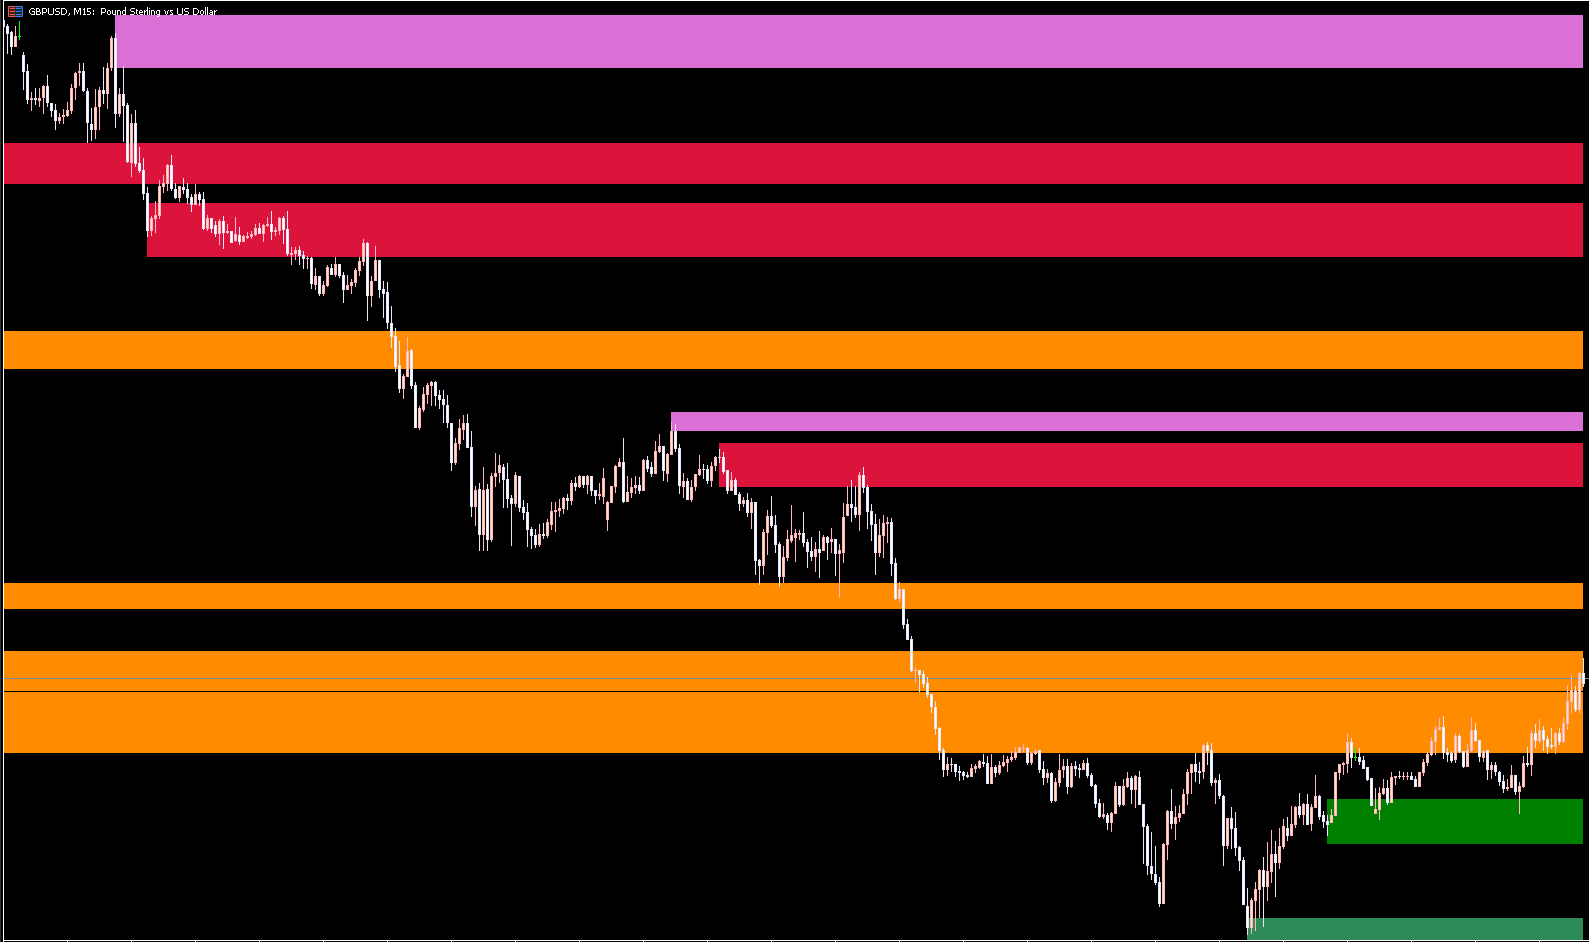
SupDem Indicator BUY/SELL Signals
The GBP/USD H4 chart below demonstrates how traders can interpret the zones to generate entries:
SELL Signal (Supply Zone)
When price reaches a red supply zone, it suggests that sellers may dominate again. This is an ideal place to look for short entries, especially if price rejection occurs or other indicators confirm bearish momentum.
BUY Signal (Demand Zone)
When price enters a green demand zone, it signals potential buying interest. Traders may consider entering long positions once price reacts positively from the zone.
Trading Weak Zones
Weaker zones are drawn in alternative shades. These areas still influence price but require caution:
Wait for a strong price reaction
Look for confirmations before opening a position
Frequently Asked Questions
Is there a supply and demand indicator for MT5?
Yes. The SupDem Indicator for MT5 visually displays supply and demand zones, making it easier for traders to understand where price may reverse.
How do you use the supply and demand indicator?
You monitor the colored zones:
Demand zones act like support
Supply zones act like resistance
You then trade accordingly, ideally with confirmation from other indicators.
Conclusion
The SupDem Indicator for MT5 is a powerful market structure tool that helps traders identify key supply and demand levels. These zones offer valuable insight into potential price reversals and high-probability trade opportunities. Whether you trade short-term or long-term, this indicator provides a clear view of market dynamics. Best of all, it’s free to download on IndicatorForest.com.
FAQ
12 Downloads
Published:
Nov 18, 2025 10:28 AM
Category: