Active intraday traders and scalpers understand the importance of precision when entering the market. Small price fluctuations—known as tick data—can reveal crucial insights about market momentum and Trend Strength. However, in MetaTrader 4, tick data is only visible in the classic Order window, which cannot be expanded and quickly moves into history. This makes real-time monitoring difficult.
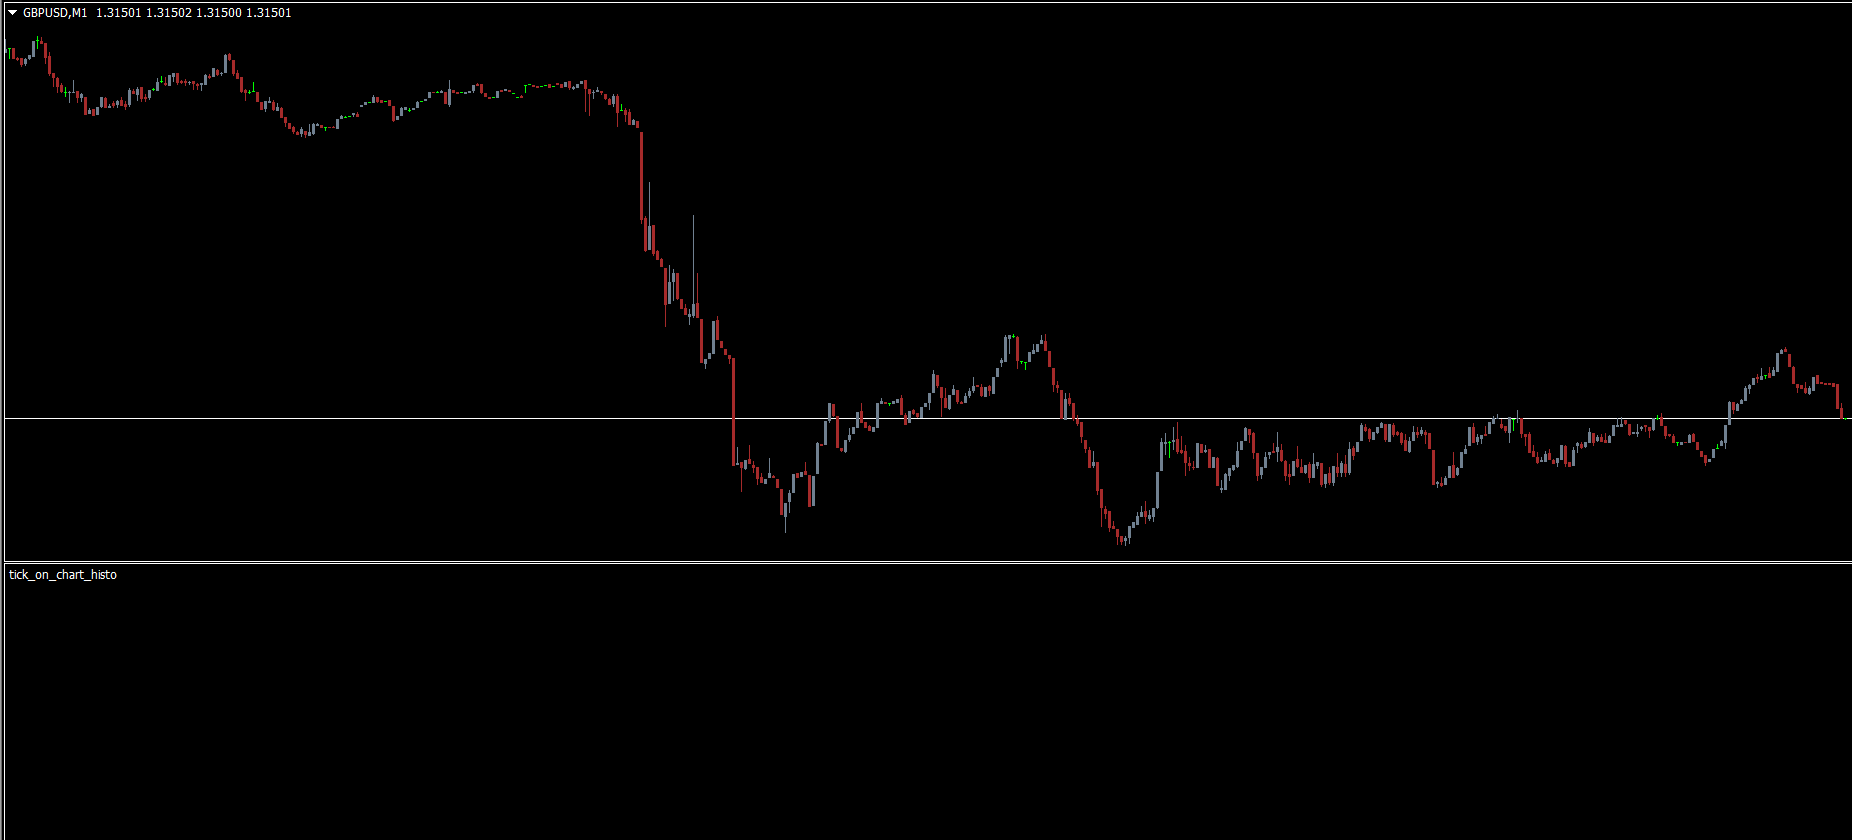
The Tick On Chart Histogram MT4 resolves this limitation by displaying tick data directly on your chart in the lower part as a scalable histogram. This visualization helps traders track market impulses and identify more accurate entry points.
How the Tick On Chart Histogram Works
The indicator collects tick data in real time and automatically plots it as a histogram. Unlike standard price bars or candlesticks, the histogram focuses solely on the smallest price fluctuations, allowing traders to:
Observe the occurrence and fading of market impulses
Analyze tick data over extended periods
Find high-probability entry points for intraday trades
Because the indicator works directly on the chart, it eliminates the need to constantly check the limited Order window in MT4.
Key Features of Tick On Chart Histogram MT4
Real-Time Tick Display: See tick fluctuations instantly without switching windows
Scalable Histogram: Adjust the size of the histogram to fit your chart and preferences
Universal Compatibility: Works with any market, broker, or MT4 instrument
Simple Settings: Easy to configure, no complicated inputs required
Redraw Functionality: Bars may adjust position in the histogram for better visualization without affecting accuracy
It’s important to note that the histogram bars do not correspond to candlesticks and the indicator does not provide direct buy or sell signals. Instead, it serves as a powerful assistant for trading decisions.
How to Use Tick On Chart Histogram
Traders can use this tool to enhance their existing strategies:
Tracking Market Impulses: Identify when buying or selling pressure is increasing or fading
Accurate Entry Points: Use spikes in tick activity to time entries more precisely
Long-Term Analysis: Monitor tick patterns across multiple sessions for market insight
For optimal performance, the indicator may require a short period to collect initial tick data after restarting MT4.
Best Practices
Combine Tick On Chart Histogram with Price Action, support/resistance zones, or other indicators for better decision-making.
Avoid relying solely on tick data for trade execution; treat it as an assistant, not a signal generator.
Monitor histogram patterns to confirm market impulses before entering positions.
Conclusion
The Tick On Chart Histogram for MT4 removes the limitations of the MetaTrader terminal and is an invaluable tool for active intraday traders and scalpers. By visualizing tick fluctuations, traders can:
Find more accurate entry points
Track impulse formation and decay
Analyze tick data for strategic trading decisions
This MT4 indicator is free to download and can significantly enhance your trading efficiency, making it a must-have addition for any serious Forex trader.
For more MT4 indicators and free tools, visit IndicatorForest.com.
FAQ
1 Download
Published:
Nov 13, 2025 22:52 PM
Category: