The 3D Oscillator Indicator for MT4 is an enhanced version of the classic Stochastic Oscillator, offering traders a more refined way to identify overbought and oversold market conditions. It is designed to help traders capture trend reversals and improve trade timing by analyzing market momentum more effectively.
This indicator comprises two lines — %K and %D. The %K line reflects the current market position, while the %D line, a moving average of %K, smooths out fluctuations to generate clearer trading signals. Just like the traditional stochastic oscillator, the 3D Oscillator works well across all timeframes and currency pairs, though it’s generally more reliable on higher timeframes (H4, Daily, or Weekly) where price noise is reduced.
How the 3D Oscillator Indicator MT4 Works
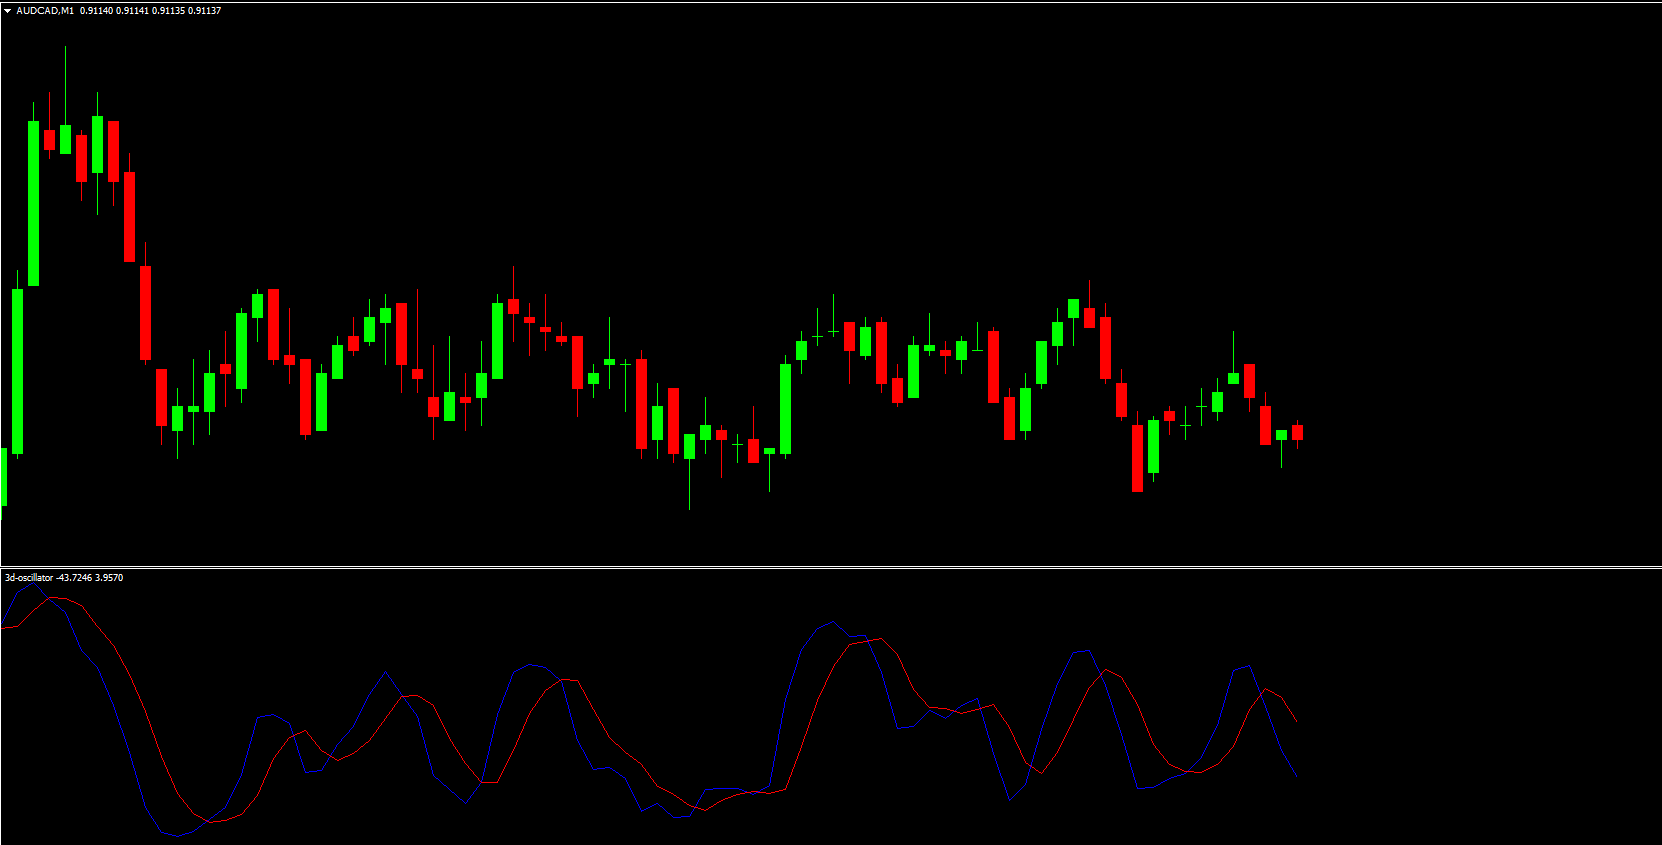
The 3D Oscillator evaluates the closing price relative to the high-low range over a specific period, giving traders a snapshot of market momentum. When Price Action shows extreme momentum, the oscillator line moves toward the upper or lower boundaries (between 0 and 100), indicating potential trend exhaustion.
Above 80: Indicates an overbought market condition. Prices may soon decline.
Below 20: Indicates an oversold condition. Prices may soon rise.
This mechanism helps traders identify potential entry and exit points, spot divergences, and recognize trend reversals.
How to Use the 3D Oscillator Indicator for MT4
The 3D Oscillator Indicator MT4 can be used in multiple ways to identify BUY and SELL signals:
Overbought and Oversold Levels:
When the oscillator rises above 80, it signals that the market might be overbought and a potential sell opportunity may arise.
When the oscillator falls below 20, the market might be oversold, signaling a buy opportunity.
Divergence Trading:
Traders can look for bullish or bearish divergences between price and the oscillator:
Bearish Divergence: Price makes higher highs, but the oscillator makes lower highs — a signal of potential downward reversal.
Bullish Divergence: Price makes lower lows, but the oscillator makes higher lows — a signal of potential upward reversal.
Trend Confirmation:
For best results, traders should combine the 3D Oscillator with other indicators like the Moving Average, RSI, or MACD for confirmation. This reduces false signals and improves trade accuracy.
Advantages of Using the 3D Oscillator Indicator for MT4
Enhanced Accuracy: Provides smoother and more reliable signals than the standard stochastic.
Multi-Timeframe Support: Works across all MT4 chart periods.
Divergence Detection: Helps identify early signs of trend reversals.
User-Friendly Interface: Simple to interpret for both novice and advanced traders.
Free to Download: Available on IndicatorForest.com.
Example: USD/JPY H4 Chart
In the USD/JPY H4 chart, when the oscillator moved above 80, the pair entered an overbought zone, signaling a short opportunity. Later, when it dropped below 20, a long trade setup appeared, coinciding with a bullish divergence between price and oscillator. This illustrates how the indicator helps traders identify profitable entry and exit points in trending or ranging markets.
Conclusion
The 3D Oscillator Indicator for MT4 is a powerful trading tool that improves upon the traditional Stochastic Oscillator. By identifying overbought and oversold levels, divergences, and Trend Strength, it enables traders to make more informed trading decisions.
Whether you’re a beginner learning momentum trading or an experienced trader refining your strategy, the 3D Oscillator is an excellent addition to your MT4 toolkit.
Download the 3D Oscillator Indicator for MT4 and explore more professional trading tools at IndicatorForest.com.
FAQ
1 Download
Published:
Nov 09, 2025 12:42 PM
Category: