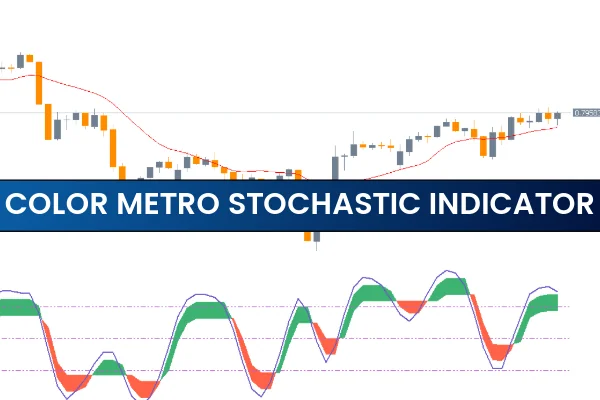
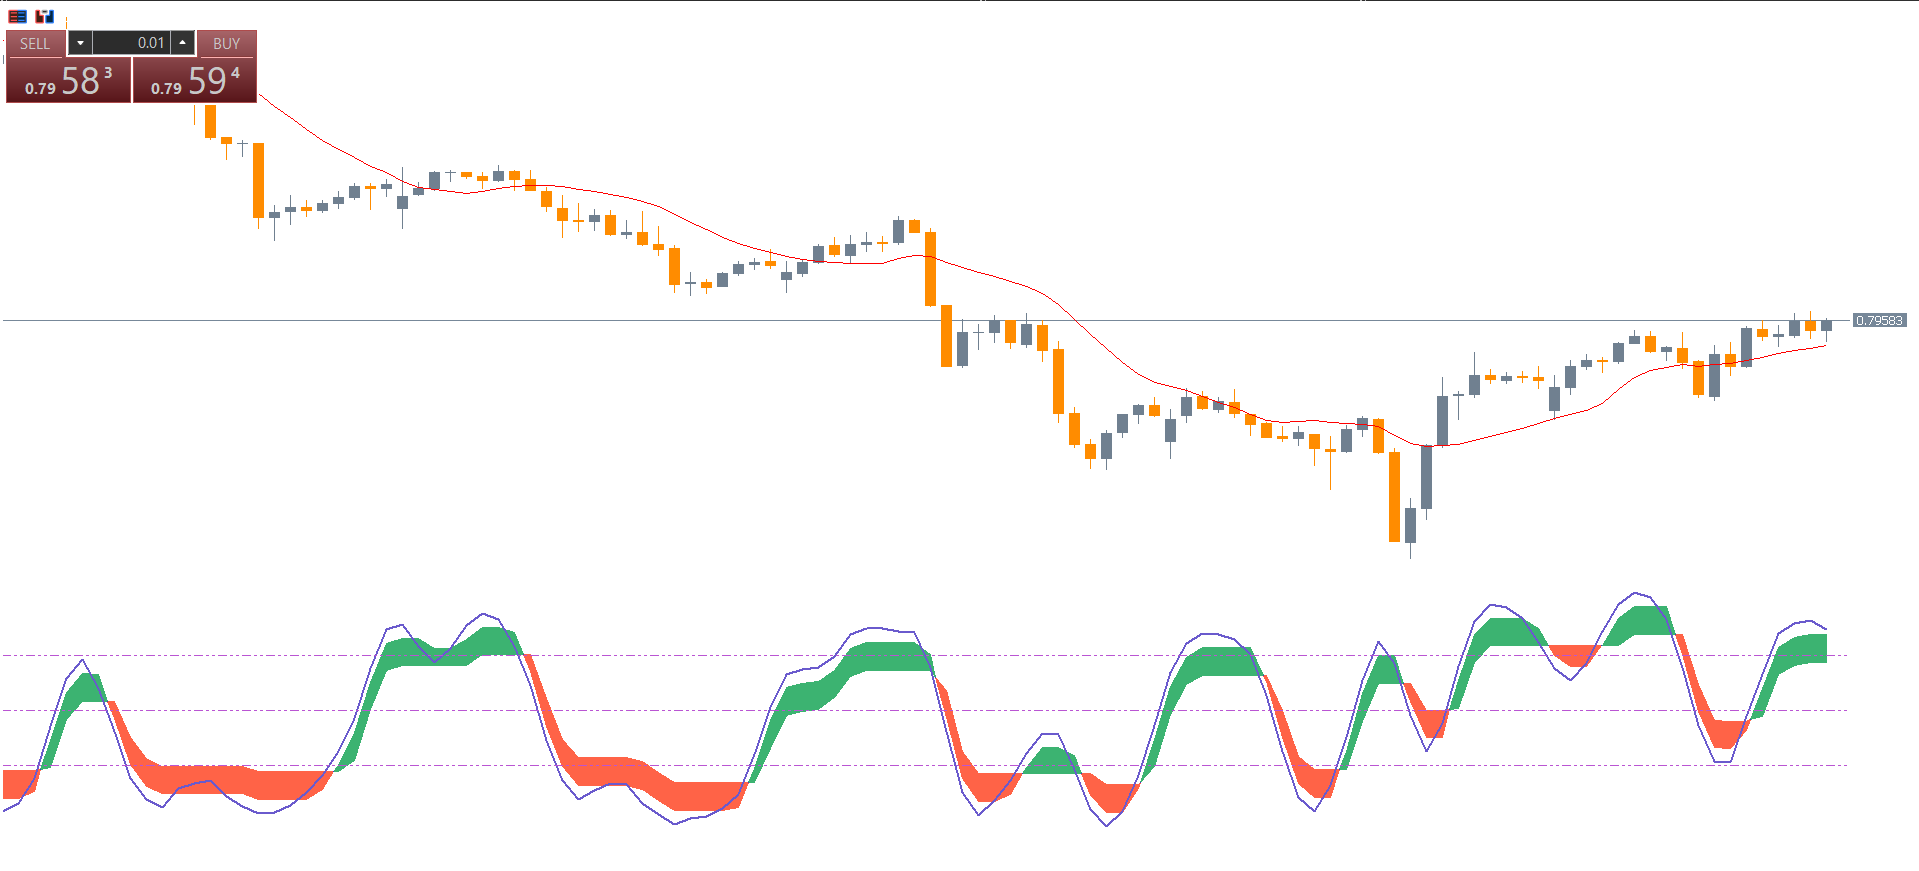
The Color Metro Stochastic Indicator for MetaTrader 5 is a modified version of the classic stochastic oscillator. It uses distinct colors to highlight extreme price zones, making it easier for traders to identify potential overbought and oversold conditions. With lime and red lines representing bullish and bearish extremes, this indicator improves visual clarity and enhances trading decisions.
This version is particularly user-friendly for beginners, allowing traders to quickly assess whether the market is approaching a potential trend reversal zone without manually calculating stochastic values.
How the Color Metro Stochastic Indicator Works
The indicator focuses on extreme price zones:
Red Line: Represents the overbought zone and signals potential selling opportunities.
Green Line: Represents the oversold zone and signals potential buying opportunities.
By visually differentiating overbought and oversold zones with colors, traders can immediately recognize market extremes. This visual cue speeds up trade decisions and improves accuracy when combined with other technical analysis tools.
How to Trade Using the Color Metro Stochastic Indicator
Buy and Sell Signals
Buy Position: When the indicator line turns green, signaling an oversold condition.
Sell Position: When the indicator line turns red, signaling an overbought condition.
It’s important to note that these signals work best when confirmed with price action, Candlestick Patterns, or other technical indicators to avoid false signals.
Trending Market Confirmation
The indicator performs better in trending markets. For example, in a bullish trend, the line may change to light green, and a bullish engulfing candle can act as confirmation for a buy entry. Similarly, in a bearish trend, the line turns red, and a confirming bearish candle can signal a sell entry.
Combining With Other Indicators
For improved reliability, traders can combine the Color Metro Stochastic with:
Support And Resistance levels
Moving averages
Trend-following indicators
This approach ensures high-probability trades and reduces the risk of false breakouts or reversals.
Advantages of the Color Metro Stochastic Indicator
Visual Clarity: Easy-to-read color-coded overbought and oversold zones.
Beginner-Friendly: Allows traders to quickly identify extreme price levels.
Flexible Trading: Suitable for Scalping, day trading, and swing trading.
Trending Market Efficiency: Works best with trending pairs for confirming reversals.
Enhanced Decision-Making: Helps traders combine visual cues with other technical indicators for accurate entries.
Conclusion
The Color Metro Stochastic Indicator for MT5 is an upgraded version of the standard stochastic oscillator, providing visual cues for overbought and oversold zones. By using distinct colors for extreme conditions, traders can easily spot potential reversal points, making it highly effective for both beginners and experienced traders.
For more trading tools and to download the Color Metro Stochastic Indicator for free, visit IndicatorForest.com today.
FAQ
4 Downloads
Published:
Nov 17, 2025 10:55 AM
Category: