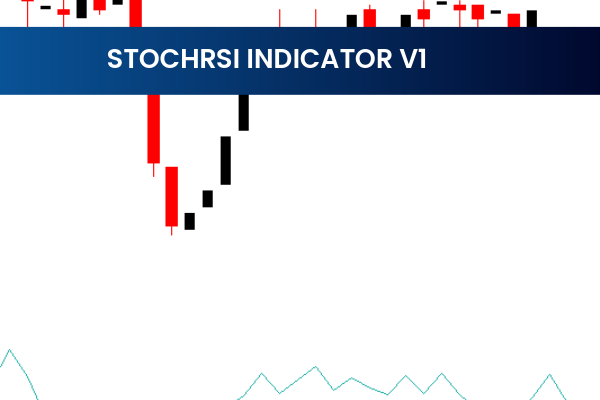
Precision Market Analysis: A Deep Dive into the RBCI Hist Indicator
In the complex world of technical analysis, traders are constantly searching for tools that can cut through the "market noise"—those erratic price movements that often lead to false signals and premature entries. The RBCI Hist Indicator (Range Bound Channel Index Histogram) stands out as a professional-grade solution designed to isolate the true market cycle from the surrounding chaos. By utilizing digital filtering technology, this indicator provides a level of clarity that standard oscillators simply cannot match.
Understanding the RBCI Hist Logic
The RBCI is built upon the principles of digital signal processing. While most indicators rely on simple or exponential moving averages, the RBCI Hist uses a sophisticated digital filter to strip away both high-frequency noise and very low-frequency trend components. What remains is the "middle" frequency—the actual market cycle that drives profitable swing and day trading opportunities.
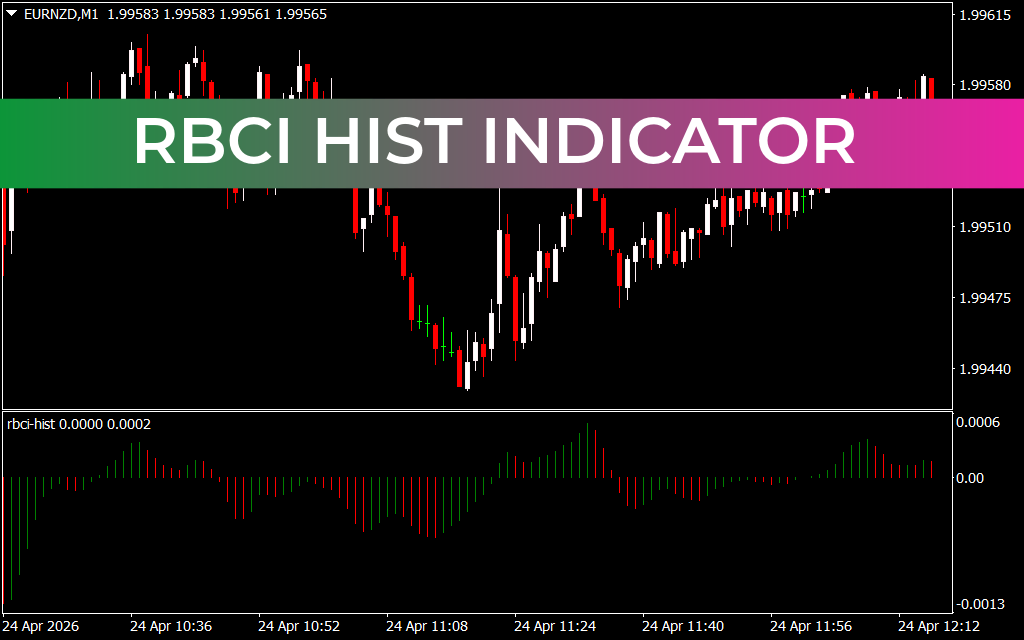
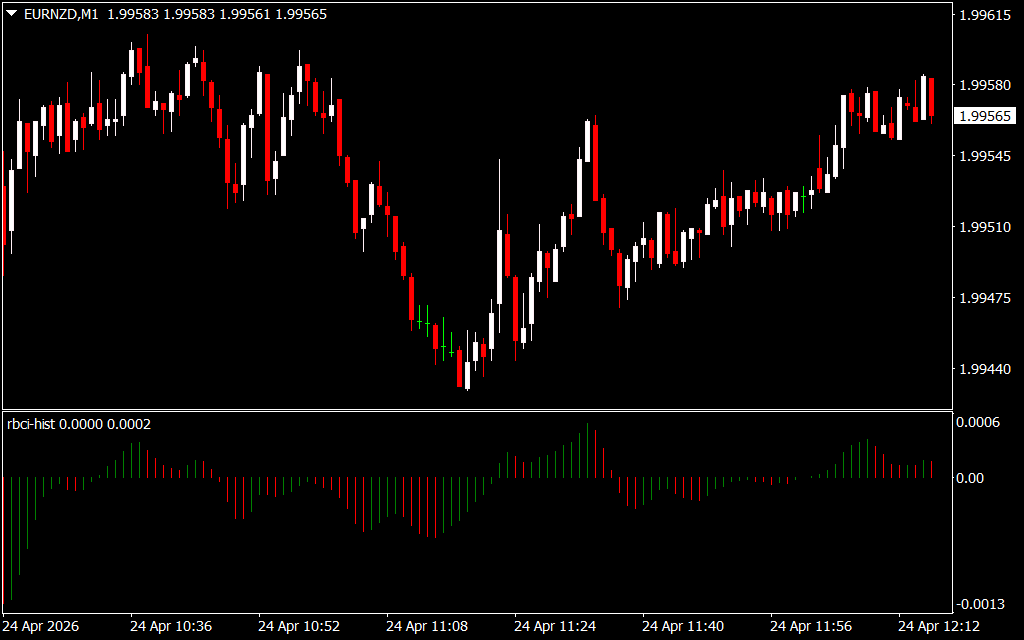
As shown in the EURNZD M1 chart, the indicator is displayed as a histogram oscillating around a central zero line. This visual representation allows traders to instantly gauge the current momentum and the phase of the market cycle without cluttering the main price chart.
Key Benefits for Modern Traders
- Cyclic Clarity: The RBCI Hist is exceptional at identifying the natural ebb and flow of the market. By recognizing when a cycle is reaching its peak or trough, traders can anticipate reversals before they occur in the Price Action.
- Visual Trend Confirmation: The color-coded histogram bars (green for bullish, red for bearish) provide immediate feedback. When the bars cross the zero line, it signals a shift in the dominant market force.
- Reduced Lag: Because it uses advanced digital filtering, the RBCI Hist often reacts faster than traditional oscillators like the RSI or MACD. This allows scalpers to enter trades at the very beginning of a momentum shift.
- Divergence Spotting: One of the most powerful ways to use this tool is by looking for divergences between price and the histogram. If price hits a new high while the RBCI Hist makes a lower high, it serves as a high-probability warning of an impending trend exhaustion.
Trading Strategies with RBCI Hist
To utilize the RBCI Hist effectively, traders typically look for Zero-Line Crossovers. A move from the negative zone to the positive zone suggests a buying opportunity, especially when aligned with price action breaking above short-term resistance. Conversely, a drop below the zero line indicates that sellers are taking control.
Furthermore, the height of the bars indicates the strength of the move. Increasing bar height suggests a trend is gaining strength, while shrinking bars indicate that the momentum is fading, signaling a potential exit point. Whether you are a binary options trader looking for short-term reversals or a Forex swing trader tracking H4 trends, the RBCI Hist provides the mathematical edge needed in today’s volatile markets.
1 Download
Last Update:
Apr 24, 2026 15:18 PM
Published:
Feb 03, 2026 12:33 PM
Category: