Precision Trading with the RCF MA Indicator for MT4
In the high-stakes environment of Forex trading, the ability to distinguish between market noise and a genuine trend is what separates profitable traders from the rest. While standard moving averages are a staple in technical analysis, they often suffer from significant lag or produce "whipsaw" signals in volatile markets. The RCF MA Indicator (Rate of Change Filtered Moving Average) is a sophisticated evolution of the traditional moving average, designed to provide cleaner signals and a more responsive view of Price Action.
What is the RCF MA Indicator?
The RCF MA is a specialized trend-following tool that combines the smoothing properties of a moving average with a volatility filter based on the Rate of Change (ROC). Unlike a Simple Moving Average (SMA) that treats all price data equally, the RCF MA assigns weight and filters signals based on the speed and momentum of the price movement.
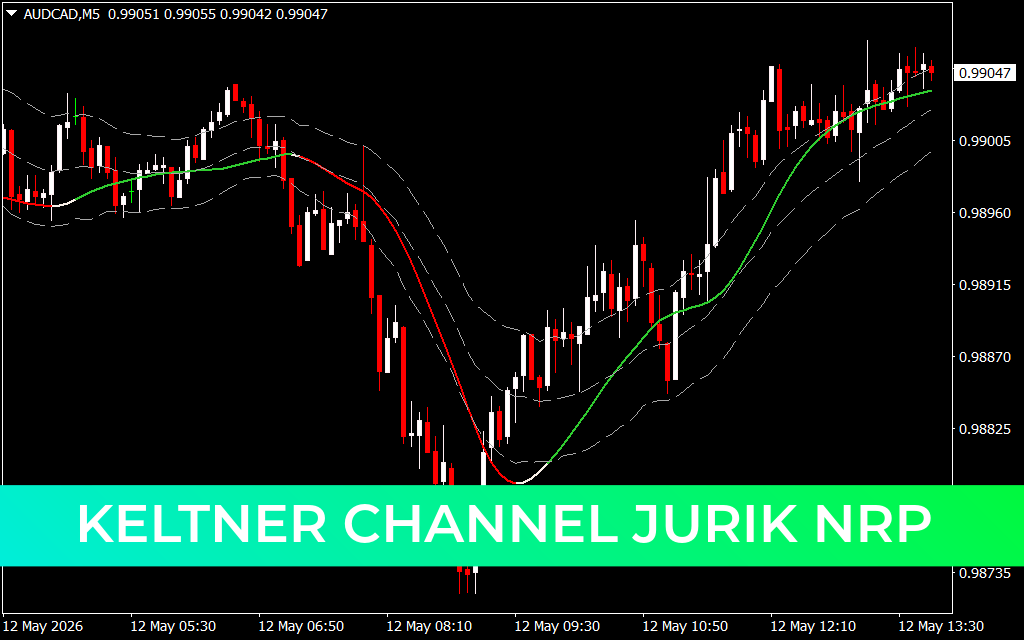
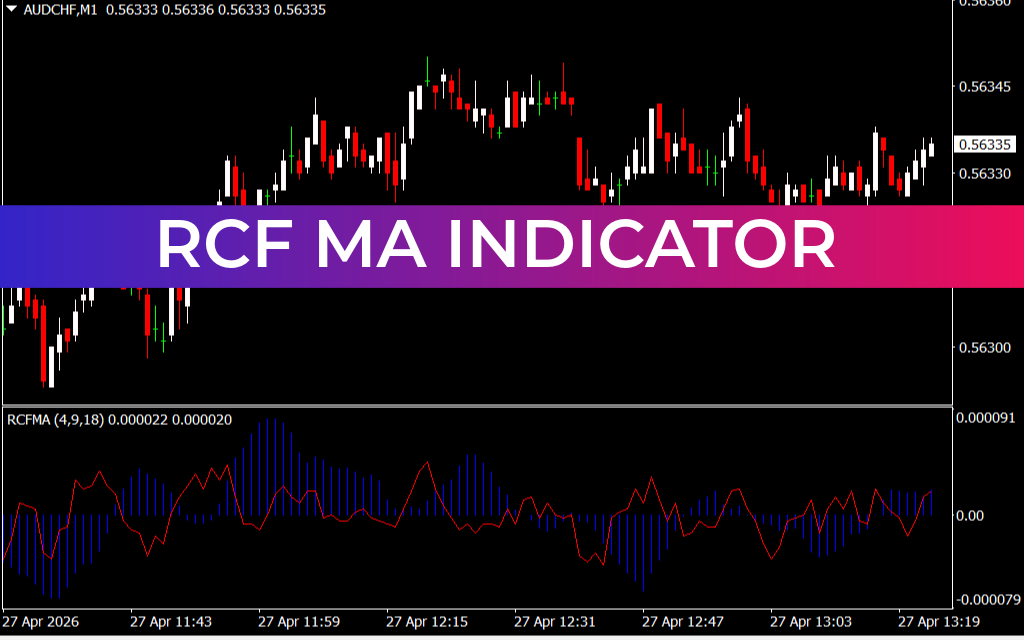
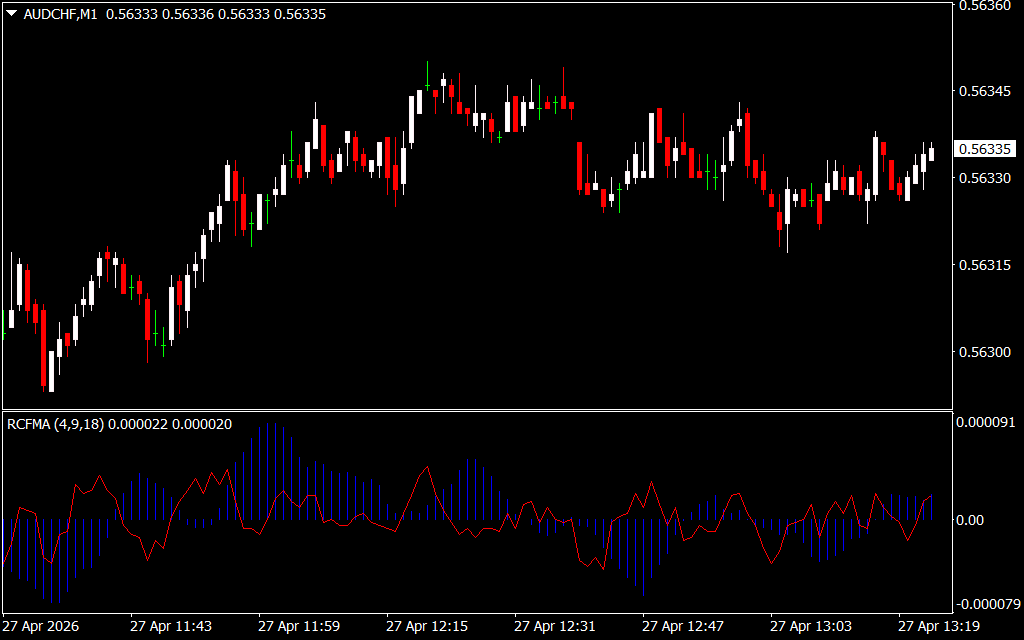
As shown in the AUD/CHF M1 chart, the indicator appears in a sub-window as a combination of a histogram (blue bars) and a signal line (red).
- The Histogram (Blue): Represents the strength and direction of the trend. When the bars are above the zero line and growing, it indicates strong bullish momentum.
- The Signal Line (Red): Acts as a dynamic threshold. When the histogram crosses the signal line, it often marks a high-probability entry or exit point.
Key Advantages of the RCF MA
- Noise Reduction: By incorporating a "Rate of Change" filter, the RCF MA ignores minor price fluctuations that would typically trigger a false signal on a standard EMA or SMA. This is particularly useful on lower timeframes like the M1 or M5.
- Momentum Identification: The indicator doesn't just show you where the price is; it shows you how fast it is getting there. Large blue bars indicate high-conviction moves, allowing you to stay in winning trades longer.
- Visual Clarity: The sub-window histogram format allows traders to keep their main price chart clean. It provides a clear, binary view of the market: Bullish (above zero) or Bearish (below zero).
Trading Strategy: The Zero-Line Crossover
One of the most effective ways to trade the RCF MA is the Zero-Line Crossover strategy.
- Buy Signal: Wait for the blue histogram bars to cross from below to above the zero line, ideally while the red signal line is also trending upward. This suggests that the bears have been exhausted and a new bullish cycle is beginning.
- Sell Signal: Conversely, when the histogram peaks and begins to retreat below the zero line, it signals a shift toward bearish control.
For advanced traders, the RCF MA is an excellent tool for spotting divergences. If the price makes a new high but the RCF MA histogram shows a lower peak, it is a strong indication that the trend is losing steam and a reversal is imminent.
SEO Meta Description
2 Downloads
Last Update:
Apr 27, 2026 16:25 PM
Published:
Feb 01, 2026 13:09 PM
Category: