The MTF MACD Indicator for MT4 (Multi-Time Frame Moving Average Convergence Divergence) is designed for traders who want to simplify multi-timeframe analysis. Instead of constantly switching between charts, this indicator displays four timeframes on one window, giving traders a clear view of trend direction and momentum across multiple levels.
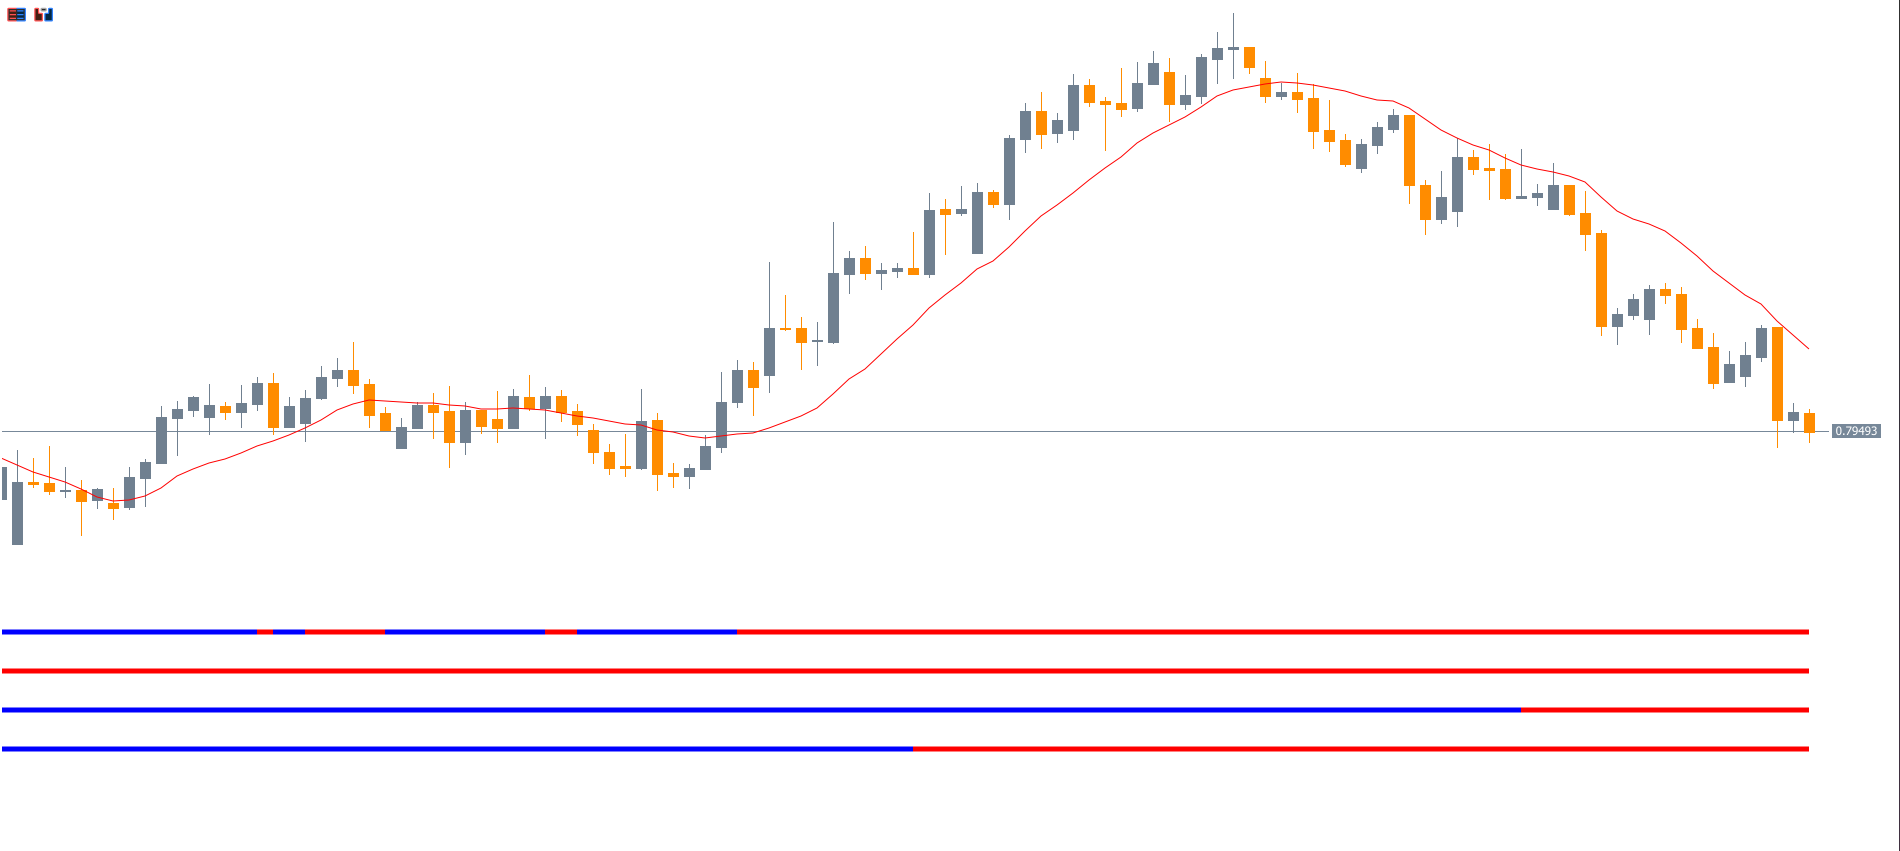
The indicator shows four color-coded lines, each representing a specific timeframe. This allows traders to instantly determine whether the market is trending bullish or bearish on the Daily, 4-hour, 1-hour, and 15-minute charts — all without leaving the current chart.
How the MTF MACD Indicator Works
The indicator automatically calculates the MACD values for each selected timeframe and represents them as colored bars or lines. Here’s how the lines are structured:
First Line (Closest to Chart): Daily timeframe
Second Line: 4-Hour timeframe
Third Line: 1-Hour timeframe
Fourth Line (Furthest from Chart): 15-Minute timeframe
This layout enables you to quickly understand the overall market bias. For example, when all four lines are blue, the market is bullish across all timeframes. Conversely, when they’re red, it signals bearish momentum.
How to Use the MTF MACD Indicator
Trading across multiple timeframes gives a clearer view of trend structure, but doing it manually can be time-consuming. The MTF MACD Indicator simplifies this process by combining all the information in one place.
Identify Trend Direction
Use the Daily and 4-hour lines to determine the main trend.
If both are blue, the trend is bullish. If both are red, it’s bearish.
Find Entry Points
For entry timing, watch the 1-hour and 15-minute lines.
For example:
Wait for the Daily bar to turn blue (uptrend).
Then, wait for the lower timeframes to turn red (pullback).
When they turn blue again, it signals a buy entry.
Combine with Other Indicators
For improved accuracy, traders can combine MTF MACD with tools like:
Moving Average Indicator for MT4
(Insert your internal links here)
Example Trade Setup
Let’s assume the indicator shows:
Daily, 4H, and 1H – all red (bearish trend)
15M – blue (temporary retracement)
This setup suggests that the market is in a downtrend, but currently retracing. The ideal move is to wait until the 15M timeframe turns red again, confirming a continuation of the main trend. This gives a strong short entry opportunity with minimal risk.
Why Use MTF MACD Indicator for MT4
Saves Time: Eliminates the need to switch charts repeatedly
Multi-Timeframe Clarity: View 4 trend levels in one window
Perfect for Scalpers and Swing Traders: Adaptable for any strategy
Enhances Accuracy: Confirms higher timeframe trend alignment
Free Download: No registration or hidden costs
Conclusion
The MTF MACD Indicator for MT4 is an essential tool for traders looking to master Trend Confirmation and improve entry timing. It provides a top-down market view on one chart, saving time and reducing confusion when analyzing multiple timeframes.
Whether you’re a scalper, day trader, or long-term investor, the Multi-Time Frame MACD will enhance your trading accuracy and consistency.
Download the MTF MACD Indicator for MT4 free today and streamline your technical analysis for better results.
FAQ
9 Downloads
Published:
Nov 13, 2025 09:56 AM
Category: