The RSI Candles Mtf Indicator for MT5 is an advanced technical analysis tool that integrates the Relative Strength Index (RSI) directly onto candlesticks. Instead of checking a separate RSI window, this indicator paints the candles based on RSI values — simplifying your chart and giving a clearer visual of market strength.
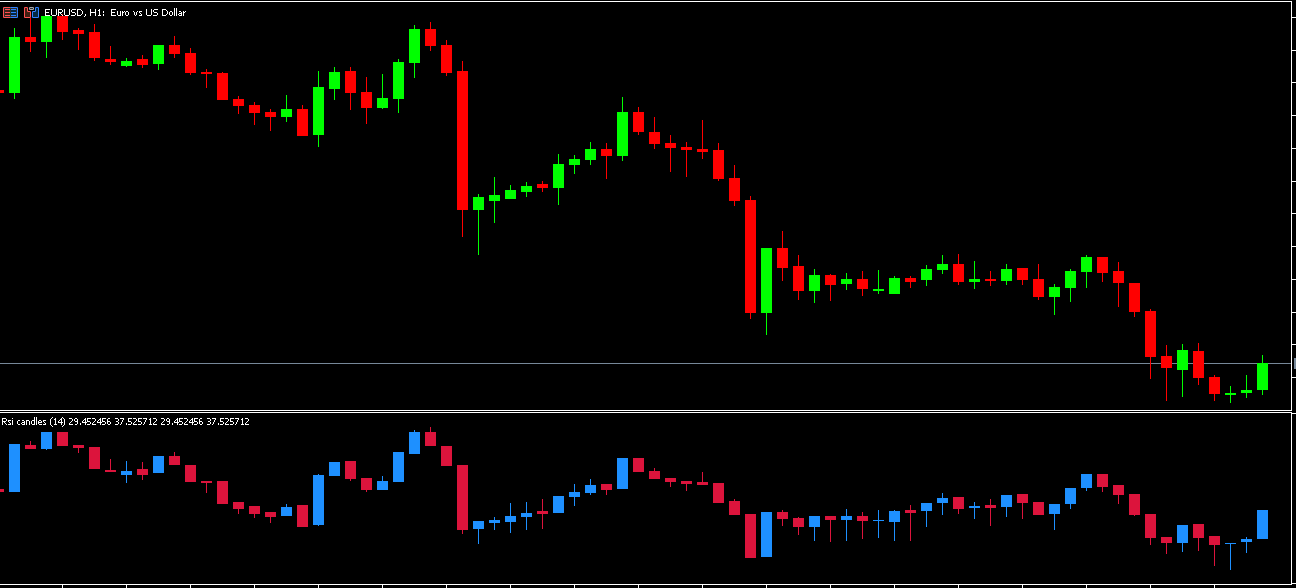
When the RSI value is above the 50 level, the indicator colors the candles blue to indicate a bullish condition. Conversely, when RSI drops below 50, the candles turn red, suggesting bearish momentum. This allows traders to identify overbought and oversold zones across multiple timeframes (MTF) without cluttering their charts.
How the RSI Candles MTF Indicator Works
The RSI Candles MTF Indicator analyzes RSI data from different timeframes and reflects it directly on the chart. This multi-timeframe feature allows traders to make more informed decisions by comparing RSI behavior from higher and lower timeframes simultaneously.
For example:
Blue Candles: RSI > 50 → indicates buyers are gaining control.
Red Candles: RSI < 50 → shows sellers are dominating.
This color-coded representation helps traders visualize market momentum at a glance, saving time and improving accuracy in identifying trend shifts.
How to Trade with the RSI Candles MTF Indicator for MT5
The RSI Candles MTF Indicator is not a direct buy or sell signal tool but an excellent visual Confirmation Indicator. Traders can combine it with Price Action or other technical indicators to refine entries and exits.
Example Strategy:
Wait for the RSI Candles MTF to show red candles while RSI is below 50.
Confirm with a bearish candlestick pattern (like an engulfing candle).
Open a sell trade after confirmation, placing stop-loss above recent highs.
For buy trades, look for blue candles with bullish price patterns when RSI is above 50. This confluence increases the probability of successful trades.
Benefits of Using the RSI Candles MTF Indicator
1. Multi-Timeframe Analysis
It allows traders to monitor RSI behavior across multiple timeframes in one chart — perfect for swing and intraday traders.
2. Clean and Simplified Charts
By embedding RSI data on the candles, you can remove extra sub-windows, creating a clearer chart layout for technical analysis.
3. Quick Overbought/Oversold Detection
Spotting overbought and oversold conditions becomes instant, helping traders identify potential reversals faster.
4. Customizable Visualization
Traders can adjust RSI levels, colors, and timeframe settings according to their trading style.
Best Practices When Using the RSI Candles MTF Indicator
Combine the indicator with Support And Resistance zones to filter false signals.
Confirm RSI readings with trend indicators like Moving Averages or MACD.
Use higher timeframe RSI data for trend direction and lower timeframe RSI for entries.
Always backtest your strategy before live trading.
Conclusion
The RSI Candles MTF Indicator for MT5 transforms traditional RSI analysis into a visually intuitive system. By painting candles based on RSI strength across multiple timeframes, it gives traders a faster, cleaner, and smarter way to interpret market momentum.
Download the RSI Candles MTF Indicator for MT5 for free at IndicatorForest.com and simplify your technical analysis today.
9 Downloads
Published:
Nov 02, 2025 13:11 PM
Category: