Support And Resistance levels are essential concepts in trading, helping traders identify key price zones where markets may reverse or continue. While an experienced trader can spot these levels visually, human observation is often subjective.
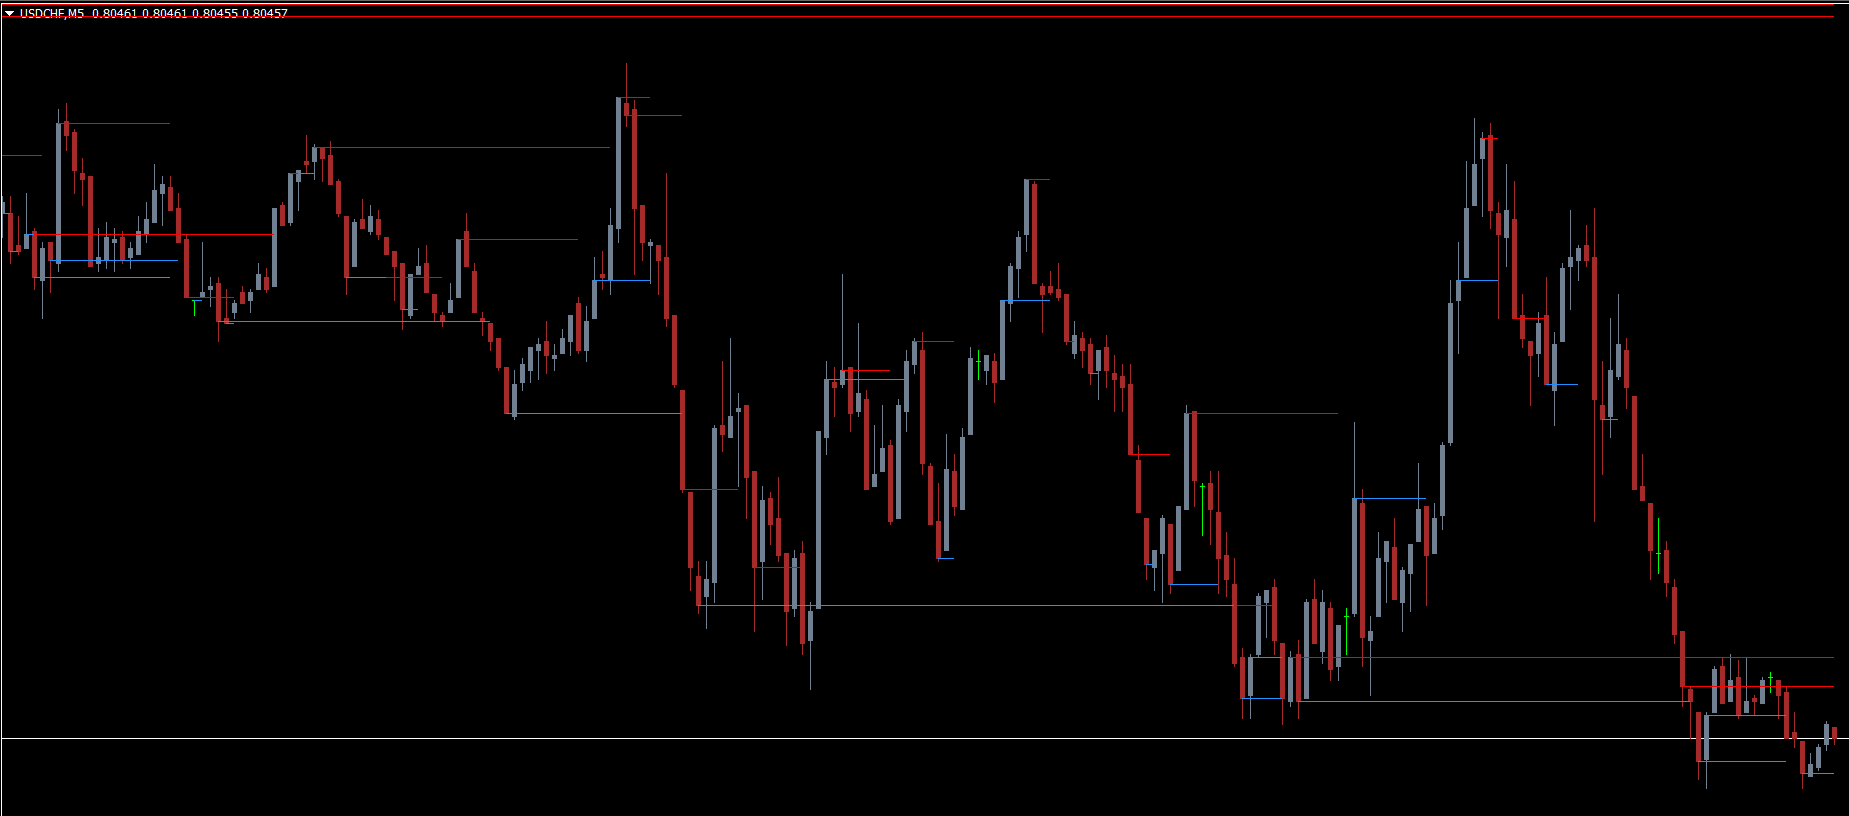
The XTSR Indicator for MT4 provides an objective method to determine critical support and resistance levels directly on your chart. With red lines indicating resistance and blue lines representing support, traders can quickly recognize price zones that may influence future market movements.
This tool is especially useful for combining with other technical indicators to confirm entries and exits, making your trading strategy more robust. Download the XTSR Indicator for MT4 for free at IndicatorForest.com.
How the XTSR Indicator Works
The XTSR Indicator scans historical and current price data to plot important support and resistance levels on your MT4 chart. These levels are dynamically updated, helping traders react to price breakouts, pullbacks, and reversals in real time.
Red Lines: Indicate resistance levels, where price may struggle to rise.
Blue Lines: Indicate support levels, where price may find a floor.
By visualizing these levels, the XTSR indicator reduces subjectivity in your analysis and provides a data-driven approach for your trading decisions.
How to Trade Using the XTSR Indicator
Combining XTSR with Other Indicators
Trading with support and resistance levels alone can be challenging. The XTSR Indicator works best when combined with additional tools, such as:
FX Forecaster – Use the histogram to time entries.
Fibonacci Retracement – Identify pullback levels near 38.2% or 50.0% for safer entries.
Trend Indicators – Confirm the overall market direction.
These combinations help reduce false signals and improve trade accuracy.
XTSR Bullish / Buy Signals
A buy signal occurs when price breaks above a resistance line. To execute a trade:
Wait for the breakout candlestick to close above resistance.
Optionally, apply a Fibonacci retracement and wait for a pullback near 38.2% or 50.0%.
Enter at the first bullish candle after the pullback.
Hold the position until the next resistance level is reached or formed.
This strategy allows traders to enter trades in alignment with market momentum while minimizing risk.
XTSR Bearish / Sell Signals
A sell signal occurs when price breaches a support line downward. To trade:
Wait for the breakout candlestick to close below support.
Optionally, use a Fibonacci retracement and wait for a pullback near 38.2% or 50.0%.
Enter at the first bearish candle (red) after the pullback.
Hold until the next support level is reached or formed.
Using XTSR for objective resistance and support tracking helps traders make more informed short-term or swing trading decisions.
Advantages of the XTSR Indicator MT4
Objective Support/Resistance Levels – Removes subjectivity from visual analysis.
Alerts for Breakouts – Quickly act on key price movements.
Compatible with Other Indicators – Ideal for combined strategies with Fibonacci or trend indicators.
Real-Time Updates – Dynamically adjusts to new market levels.
Beginner-Friendly – Easy to read with clear red and blue lines.
This tool is suitable for novice and advanced traders looking to enhance their technical analysis workflow.
Conclusion
The XTSR Indicator for MT4 provides an objective and clear method for identifying support and resistance levels, eliminating the guesswork of manual chart analysis. By combining it with other indicators like Fibonacci retracements or trend tools, traders can improve entry timing and trade accuracy.
While it’s a powerful tool, support and resistance levels alone aren’t enough for a complete trading strategy. Always complement XTSR with risk management, trend analysis, and proper trade planning.
👉 Download the XTSR Indicator for MT4 for free at IndicatorForest.com and make your support and resistance analysis objective and actionable.
FAQ
2 Downloads
Published:
Nov 10, 2025 14:38 PM
Category: