Mastering Institutional Order Flow with the Max Volume in Bar Indicator
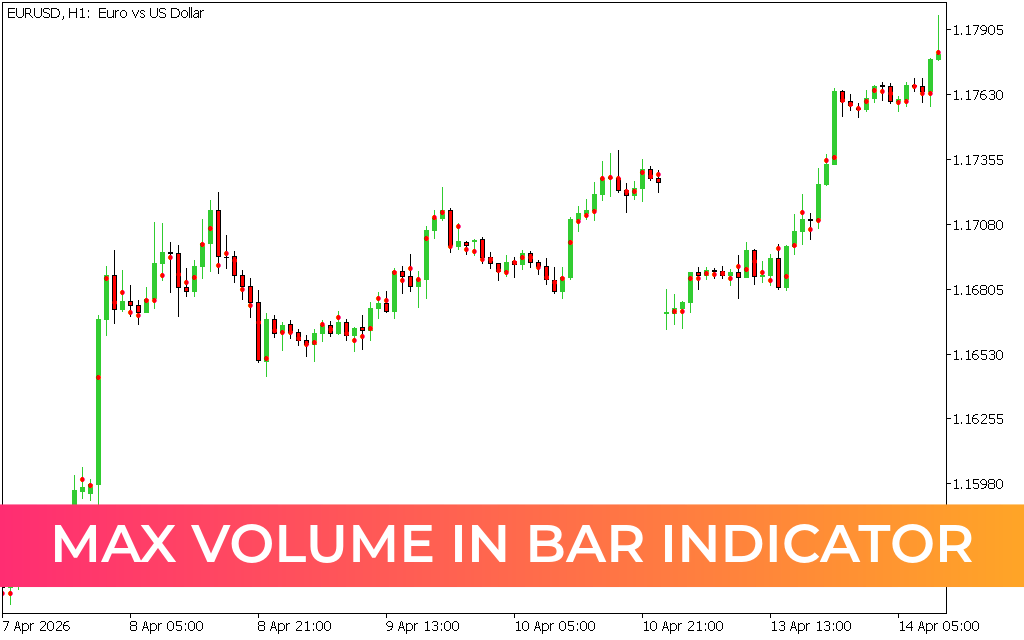
In the competitive landscape of financial trading, Price Action alone often fails to tell the full story. To gain a true professional edge, traders must look toward the primary catalyst of market movement: Volume. The Max Volume in Bar Indicator for MetaTrader (MT4/MT5) is an essential analytical tool designed to reveal the "Point of Control" within every single candlestick. By pinpointing exactly where the highest concentration of trading activity occurred during a specific period, this indicator exposes the hidden footprints of institutional banks and large-scale liquidity providers.
The Power of Intra-Bar Volume Analysis
Standard volume indicators typically show the total volume for a candle, which provides an incomplete picture. The Max Volume in Bar Indicator provides a granular perspective by highlighting the specific price level within a bar where the most contracts or lots were exchanged. This level represents a critical zone of supply or demand that the market is mathematically inclined to respect in future sessions.
As demonstrated in technical analysis across major currency pairs like AUD/CAD on the H1 timeframe, this tool provides a significant structural advantage:
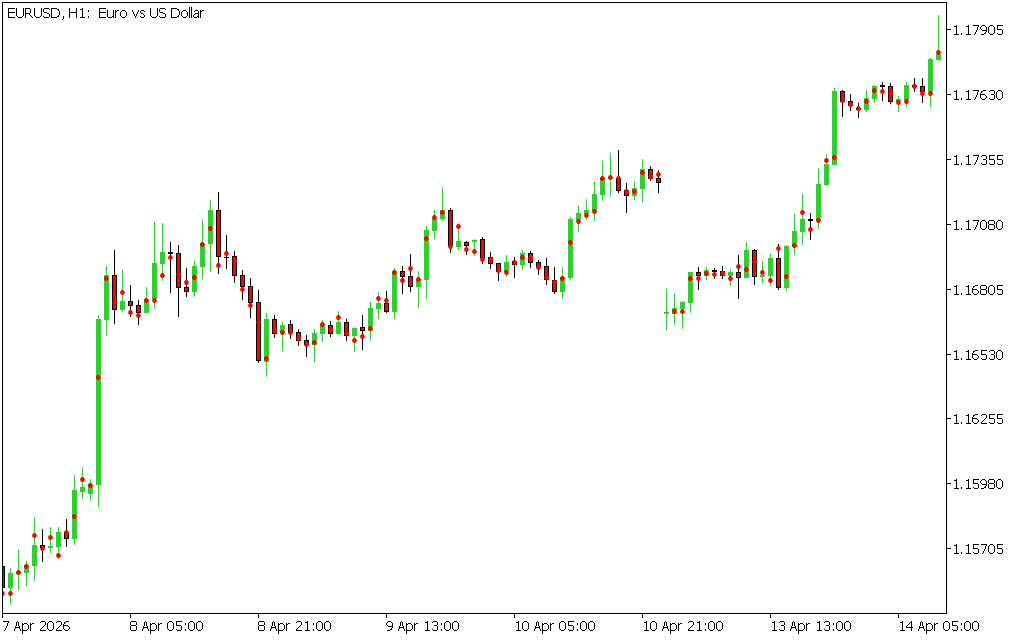
- Visualizing Smart Money Entry: The indicator marks the maximum volume level with a distinct visual cue—often a dot or a line—directly on the price bar. This allows traders to see if institutional interest is absorbing sell orders at the bottom of a candle or if a rally is losing steam with high-volume rejection at the top.
- Precision Support And Resistance: High-volume nodes act as magnetic zones. When price returns to a previous "Max Volume" level, it frequently reacts with high sensitivity, offering surgical entry opportunities with exceptionally tight stop-loss placement.
- Confirming Breakout Strength: During a breakout, the placement of the max volume node is a vital confirmation signal. If a price breach is accompanied by high volume at the breakout level itself, it confirms strong institutional conviction, reducing the likelihood of a "fake-out".
- Identifying Divergence: If price continues to push higher while the max volume levels remain clustered at the bottom of the bars, it indicates a lack of buying support, warning traders of an imminent reversal.
Why Order Flow Traders Choose This Tool
Integrating intra-bar volume into your trading terminal moves your strategy beyond retail-level indicators and into the realm of professional order flow analysis.
- Objective Decision Making: You no longer have to guess if a level is significant; the indicator provides mathematical proof of where the most trading activity occurred.
- Scalping and Day Trading Edge: On lower timeframes like the M1 or M5, knowing the precise volume node allows scalpers to enter trades with minimal drawdown and maximum precision.
- Institutional Confluence: By entering trades at these institutional "walls," you align your portfolio with the direction of the smart money, drastically improving your win rate and risk-to-reward ratio.
Conclusion
The Max Volume in Bar Indicator is a definitive solution for traders who demand transparency in the markets. By exposing the specific price levels controlled by institutional volume, it empowers you to trade with clarity and discipline. Elevate your terminal today and master the art of order flow trading.
3 Downloads
Last Update:
Apr 17, 2026 19:23 PM
Published:
Feb 09, 2026 12:40 PM
Category: