Precision Market Mapping with the DeMarker Pivots Indicator for MT4
In the realm of technical analysis, the marriage of momentum oscillators and structural price levels represents the pinnacle of strategic trading. The DeMarker Pivots Indicator for MetaTrader 4 (MT4) is a professional-grade analytical tool that combines Tom DeMark’s legendary momentum logic with classic Pivot Point theory. This hybrid approach allows traders to identify high-probability reversal zones and breakout levels with institutional accuracy, ensuring that entries and exits are rooted in mathematical Market Structure rather than guesswork.
The Synergy of Momentum and Support/Resistance
The DeMarker Pivots Indicator operates by calculating potential intraday Support And Resistance levels based on the price action of the previous trading session, filtered through the lens of DeMarker momentum. Unlike standard pivot indicators that rely solely on price averages, this version prioritizes market "pressure"—identifying where buying or selling interest is likely to reach a point of exhaustion.
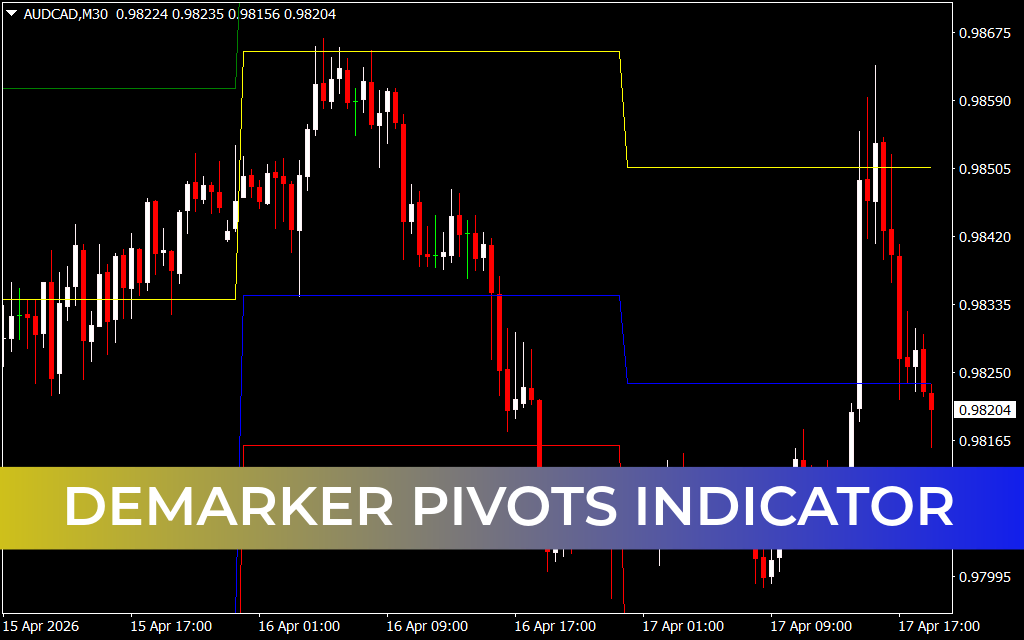
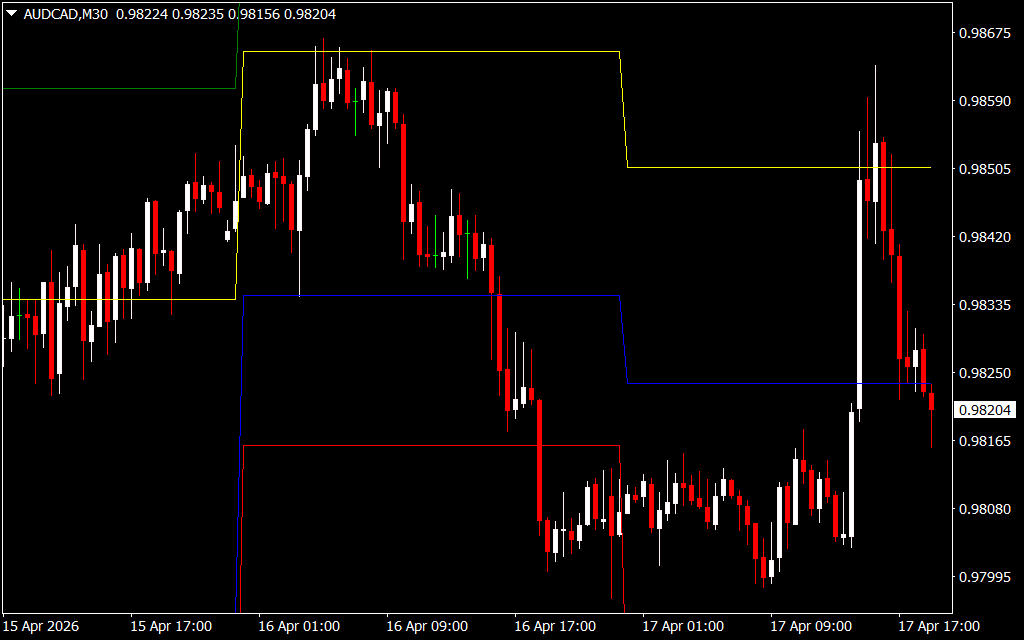
As observed in technical setups across high-liquidity pairs like EUR/USD or AUD/CAD on the M30 timeframe, the indicator provides a definitive strategic edge:
- Dynamic Floor and Ceiling Levels: The indicator plots multiple layers of support (S1, S2, S3) and resistance (R1, R2, R3). As seen on recent M30 structural charts, price frequently respects these levels, providing traders with clear "value areas" for trade execution.
- DeMarker Exhaustion Filtering: By integrating DeMark’s logic, the indicator highlights levels that coincide with overbought or oversold momentum conditions. A pivot level that aligns with momentum exhaustion is statistically more likely to hold, offering a higher win-rate for reversal strategies.
- Trend Continuation Cues: Beyond reversals, these pivot levels act as "breakout triggers." When price decisively breaches a DeMarker Pivot resistance level with high momentum, it confirms a structural shift, allowing trend-followers to enter with confidence.
- Institutional Structural Clarity: Institutional traders often use pivot levels to place large orders. By utilizing this indicator, retail traders can "see" the same structural map as the smart money, avoiding common traps and identifying real liquidity zones.
Strategic Implementation for Professional Traders
The DeMarker Pivots Indicator is an essential asset for any trader who values a systematic, rule-based approach to the markets.
- Surgical Day Trading: On lower timeframes like the M15 or M30, use the pivot levels to define your daily range. If price opens above the central pivot, the daily bias is bullish, and traders should look for entries at the S1 or Pivot levels.
- Precise Risk Management: Pivot levels provide natural "mathematical" locations for stop-losses and take-profits. Placing a stop-loss just beyond the S2 or R2 levels ensures your trade is protected by structural barriers.
- Confluence Trading: This indicator is most powerful when used alongside candlestick patterns. A "Pin Bar" or "Engulfing" pattern occurring exactly on a DeMarker Pivot level represents a top-tier trade setup.
Conclusion
The DeMarker Pivots Indicator for MT4 is a definitive solution for traders who demand structural precision and momentum-based filtering. By bridging the gap between historical price levels and real-time market pressure, it empowers you to navigate the financial markets with professional-grade clarity. Elevate your MT4 terminal today and start trading with the technical advantage of the DeMarker system.
6 Downloads
Last Update:
Apr 17, 2026 22:11 PM
Published:
Feb 08, 2026 10:46 AM
Category: