Optimize Your Trading Precision with the Color MA RSI Trigger Indicator for MT4
In the highly competitive world of Forex trading, the ability to identify high-probability entry and exit points is what distinguishes professional traders from the rest. Most retail traders struggle because they rely on single-dimension indicators that produce conflicting signals. The Color MA RSI Trigger Indicator for MetaTrader 4 (MT4) is a sophisticated technical solution designed to eliminate this confusion by merging the trend-following reliability of Moving Averages (MA) with the momentum-tracking power of the Relative Strength Index (RSI).
The Synergy of Trend and Momentum
The Color MA RSI Trigger is a "hybrid" indicator that acts as a comprehensive filter for Price Action. While a standard Moving Average can tell you the direction of a trend, it cannot tell you if that trend is becoming overextended. Conversely, the RSI can identify overbought or oversold conditions but often provides "false" reversal signals in a strong trending market. By integrating these two concepts, the Color MA RSI Trigger ensures you only take trades where both trend and momentum are in perfect alignment.
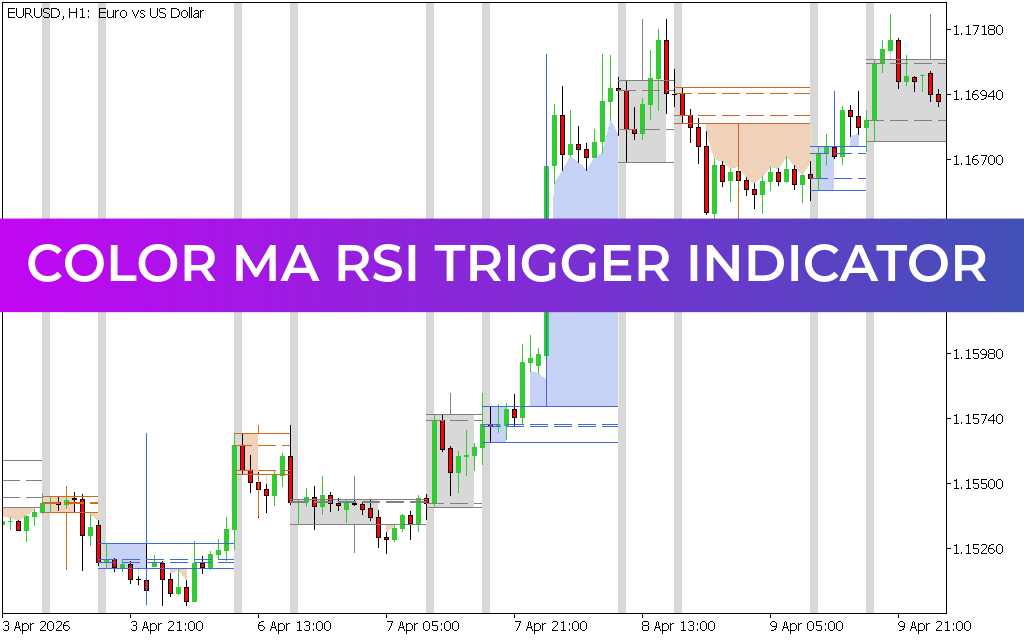
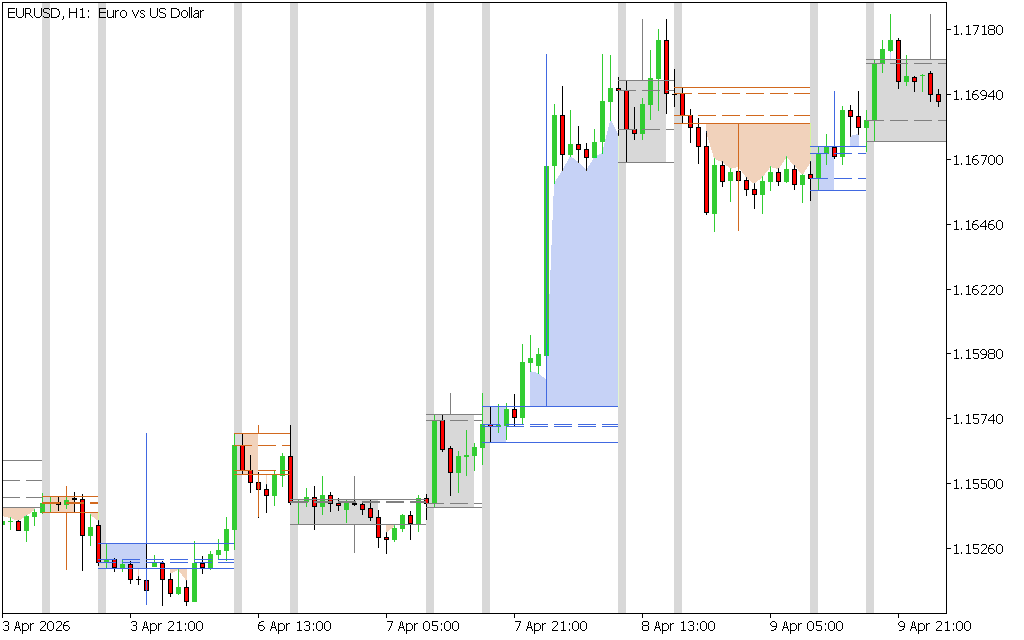
As observed in technical chart analysis, the indicator provides a multi-colored visual interface that simplifies complex data:
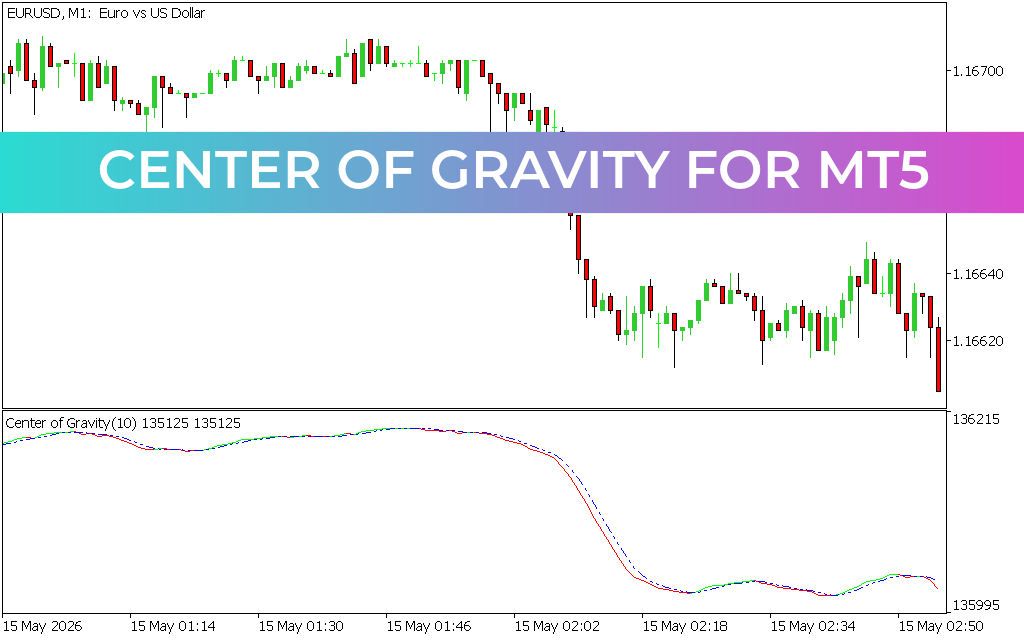
- The Dynamic Color-Coded Line: The primary signal line changes color based on the prevailing momentum. A blue or green shift indicates that bullish momentum is accelerating, while a red or orange shift warns of increasing bearish pressure.
- The Trigger Cross: The indicator uses a proprietary "trigger" mechanism. When the fast-moving RSI component crosses the smoothed MA baseline, it generates a high-conviction signal, allowing traders to enter at the very beginning of a new market phase.
- Volatility Filtering: Built-in smoothing algorithms help filter out market "whipsaws" or noise, which are common during low-liquidity sessions, ensuring you stay focused on sustainable moves.
Strategic Advantages for Modern Traders
The Color MA RSI Trigger is an essential tool for those looking to build a systematic and objective trading plan.
- Leading Entry Signals: Unlike traditional lagging indicators, the RSI component of this tool acts as a "leading" signal. It often detects shifts in momentum before they are reflected in the price candles, giving you a crucial head start.
- Visual Trend Confirmation: The color-changing feature allows for "at-a-glance" analysis. Traders can instantly determine the market bias without needing to draw complex manual trendlines.
- Versatility Across Timeframes: Whether you are a 5-minute scalper or a daily swing trader, the Color MA RSI Trigger adapts to the underlying volatility of the timeframe. It is particularly effective on the M15 and H1 charts for capturing intraday trend shifts.
- Enhanced Risk-to-Reward: By identifying exact exhaustion points where the color begins to fade or shift, traders can tighten their stop-losses and exit trades with maximum profit before a full reversal occurs.
Conclusion
The Color MA RSI Trigger Indicator for MT4 is a definitive upgrade for any technical analyst. By providing a clear, color-coded roadmap of market momentum and trend direction, it removes the emotional guesswork from trading. Elevate your MT4 platform today and harness the power of dual-layer confirmation to navigate the markets with professional confidence.
12 Downloads
Last Update:
Apr 16, 2026 13:52 PM
Published:
Feb 10, 2026 21:16 PM
Category: