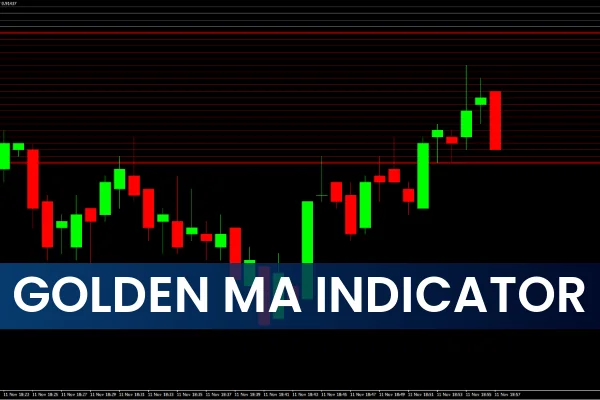
The Golden MA Indicator for MT4 is a unique forex tool that visually divides price movement into multiple dynamic zones to help traders identify optimal entry and exit levels. It automatically plots the previous day’s high and low, and marks several overbought and oversold regions, making it easier to recognize where price may reverse.
Unlike standard moving averages that show only trend direction, the Golden MA adds a strategic layer by showing buy, sell, and neutral areas. These zones serve as dynamic support and resistance levels, guiding traders in decision-making.
This indicator is compatible with all MT4 chart timeframes, from short-term intraday trading to longer swing setups.
How the Golden MA Indicator Works
When applied to your MT4 chart, the Golden MA indicator displays multiple colored levels:
Blue Zones: Indicate the buy area (from start to end).
Red Zones: Represent the sell area (from start to end).
Grey Zones: Neutral area (sideways or consolidation).
Orange Lines: Mark the previous day’s high and low.
Danger & Warning Lines: Indicate potential overbought or oversold extremes.
These visual levels help traders spot high-probability trade setups while managing risk effectively.
How to Trade Using the Golden MA Indicator
Buy Setup
Wait for the price to touch the Buy Area Start line (blue) and begin to move higher.
Place your stop-loss below the end of the Sell Area.
Consider taking profit near the Reversal High or Overbought level.
Pro Tip: Confirm the entry with candlestick patterns or momentum oscillators (e.g., RSI, Stochastic).
Sell Setup
Wait for the price to touch the Sell Area Start line (red) and start declining.
Set your stop-loss above the Buy Area End line.
Target the Reversal Low or Oversold level for profit-taking.
Avoid entering at “Danger Stop Buy Here” or “Danger Stop Sell Here” levels — these zones often indicate exhaustion and potential reversal.
Example of Golden MA in Action
On an intraday chart (e.g., EUR/USD H1), you’ll see:
Blue zone marking buy interest.
Red zone highlighting potential sell entries.
Orange lines defining the previous day’s high and low, acting as major intraday reference points.
This setup helps traders quickly visualize key market levels without manually drawing Support And Resistance lines.
Why Traders Love the Golden MA Indicator
Clearly defined buy/sell zones for quick decisions.
Displays multi-level dynamic support and resistance.
Helps avoid emotional entries by providing structured zones.
Works across all timeframes and currency pairs.
Sitable for both beginners and advanced traders.
Trading Tips
Combine the indicator with Price Action or trend confirmation tools for best results.
Use the previous day’s high/low as additional validation for breakout or reversal trades.
Maintain a risk-to-reward ratio of at least 1:2 to protect capital.
Conclusion
The Golden MA Indicator for MT4 is a powerful visual trading tool that simplifies the process of identifying entry and exit zones. By automatically plotting support, resistance, and dynamic trend zones, it allows traders to trade confidently with structure and clarity.
While it can be used alone, pairing it with price action analysis and proper money management can further enhance performance.
Download the Golden MA Indicator for MT4 for free at IndicatorForest.com and take your market analysis to the next level!
FAQ
1 Download
Published:
Nov 11, 2025 13:03 PM
Category: