The PDF Indicator operates by tracking and transforming historical price behavior into a structured visual format. It essentially converts the raw data into a dynamic channel that reacts to the market’s historical highs and lows.
When the channel line rises, it suggests that the market is in a bullish phase or likely to move upward.
When the channel line falls, it indicates a bearish sentiment or potential downward movement.
When the line moves sideways, it shows consolidation or neutral momentum in the market.
Because of its historical analysis capability, the indicator doesn’t rely on current price spikes or short-term volatility. Instead, it helps traders understand how the market has behaved over time — which often repeats itself.
How to Trade Using the PDF Indicator for MT4
While the PDF Indicator doesn’t issue traditional BUY/SELL signals, it provides traders with a framework to make informed decisions. Let’s go through a practical trading approach.
Identify Market Direction
Look at how the channel line moves:
If the channel shows consistent lows (bottom patterns), it suggests bullish pressure — a potential BUY setup.
If the channel draws highs (top patterns), it indicates bearish momentum — a potential SELL setup.
Confirm with Price Action
Combine the indicator with candlestick patterns or other confirmation tools such as Moving Averages, RSI, or MACD to validate your entry and exit points.
Set Entries and Exits
Entry: When the channel direction confirms the trend and Price Action supports it.
Stop Loss: Below the recent swing low (for BUY) or above the recent swing high (for SELL).
Take Profit: At the next significant support or resistance level, or when the channel starts to flatten or reverse.
Multi-Timeframe Use
The PDF Indicator for MT4 works efficiently on all timeframes.
On lower timeframes (M15, H1) — it provides short-term trend insights.
On higher timeframes (H4, Daily) — it gives a clearer picture of long-term Market Structure and behavior.
Traders can align signals from different timeframes for higher accuracy and better trade timing.
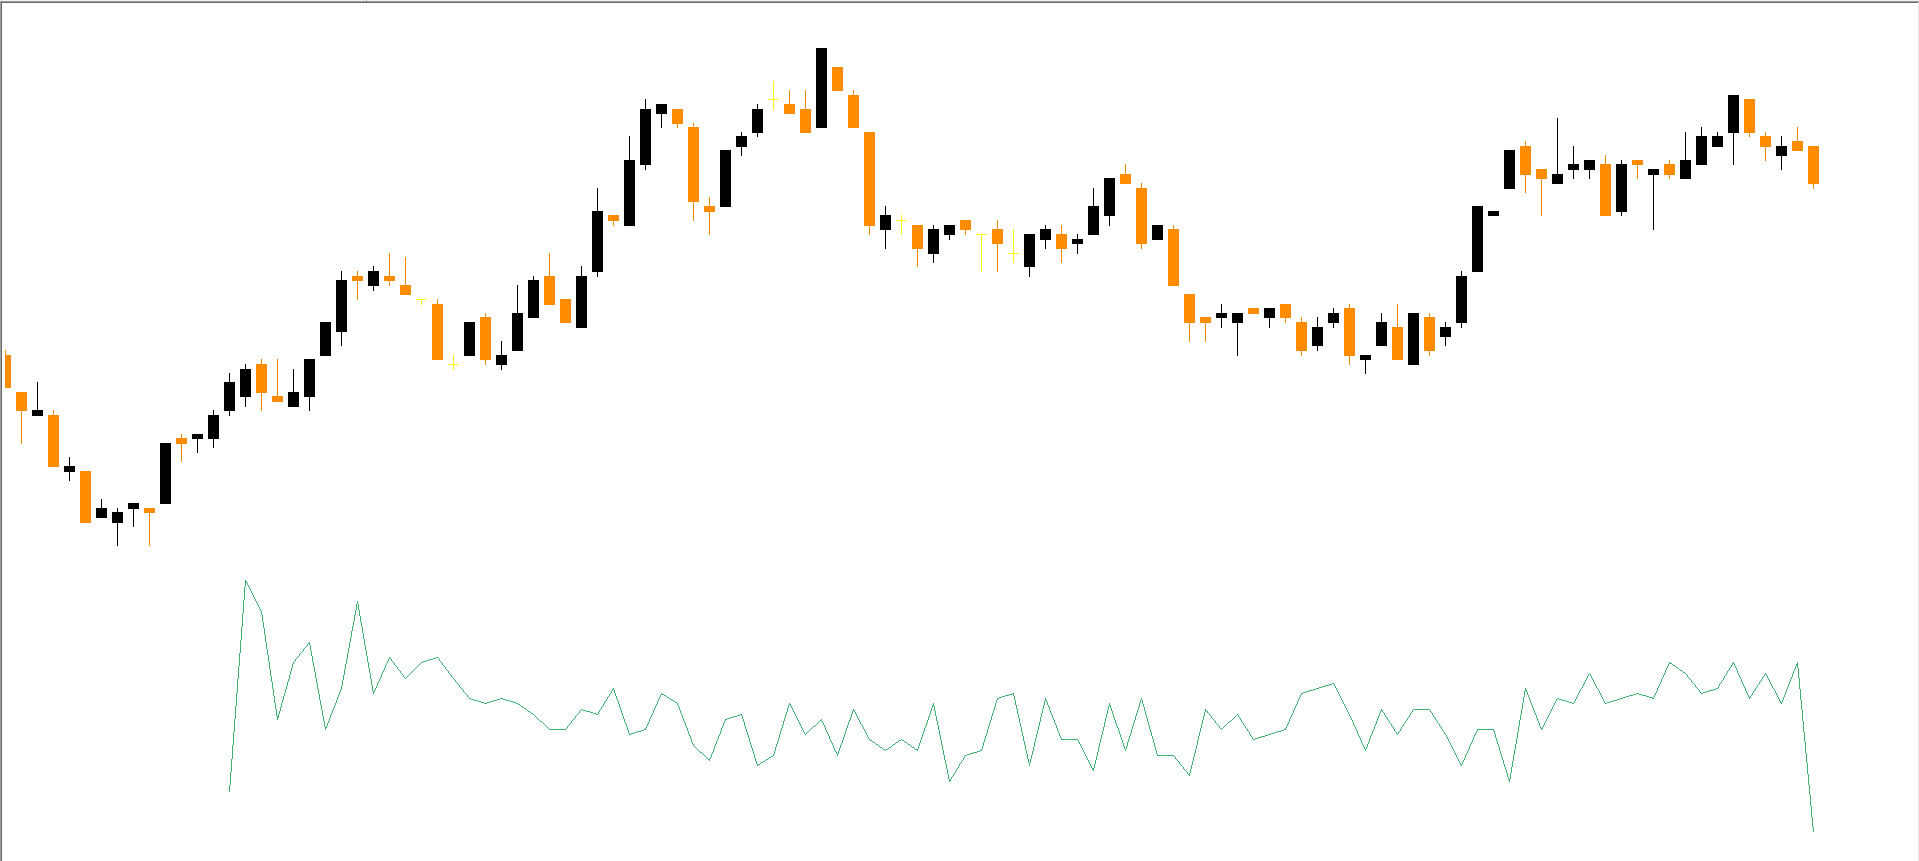
PDF Indicator Example on MT4 Chart
As seen in the GBP/USD H4 chart example, the PDF Indicator displays a smooth channel line that tracks the historical highs and lows of the currency pair.
When the indicator’s line starts forming lower highs, it implies a potential bearish trend. Conversely, when it creates higher lows, it reflects strengthening bullish pressure.
This helps traders predict possible price reversals or continuation patterns even before they fully develop.
Why Use the PDF Indicator for MT4
Here are some major benefits of using this indicator in your trading system:
Simple and intuitive interface — ideal for both beginners and advanced traders.
Identifies hidden patterns in historical data that most indicators overlook.
Applicable to all timeframes and assets — forex pairs, commodities, indices, and crypto.
Compatible with all MT4 brokers and templates.
Free to download and easy to install — no coding or configuration required.
Best Strategies to Combine with PDF Indicator
To enhance accuracy, combine the PDF Indicator with:
Moving Average Indicator (for trend confirmation)
Bollinger Bands (for volatility confirmation)
RSI or Stochastic Oscillator (for entry timing)
Support/Resistance levels (for better take-profit positioning)
This multi-indicator approach helps reduce false readings and provides a more comprehensive market outlook.
Conclusion
The PDF Indicator for MT4 is a lightweight, data-focused trading tool that turns historical price information into actionable insights. While it doesn’t issue direct trading signals, its channel line reveals vital highs and lows that can guide your trading decisions.
By interpreting historical price dynamics, you can anticipate potential market moves, refine your strategies, and reduce uncertainty. Whether you’re a day trader, swing trader, or long-term investor, this indicator offers a valuable edge — and best of all, it’s completely free to download and easy to integrate into MetaTrader 4.
FAQ
1 Download
Published:
Nov 12, 2025 23:19 PM
Category: