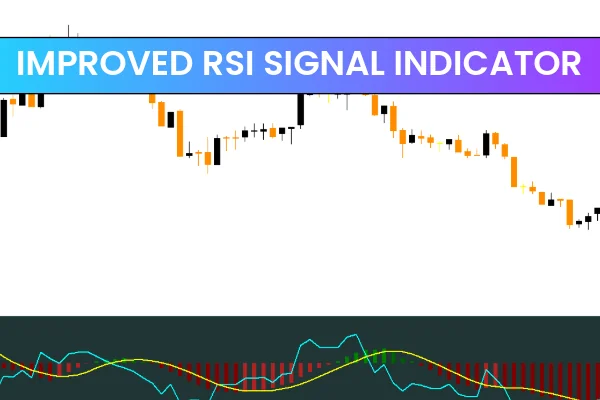
The Improved RSI Signal Indicator for MetaTrader 4 (MT4) is a financial market trend analyzer that detects reversal zones of an instrument. It is a technical analysis system built with the Relative Strength Index (RSI) and the Moving Average (MA) to identify trading opportunities at overbought and oversold zones.
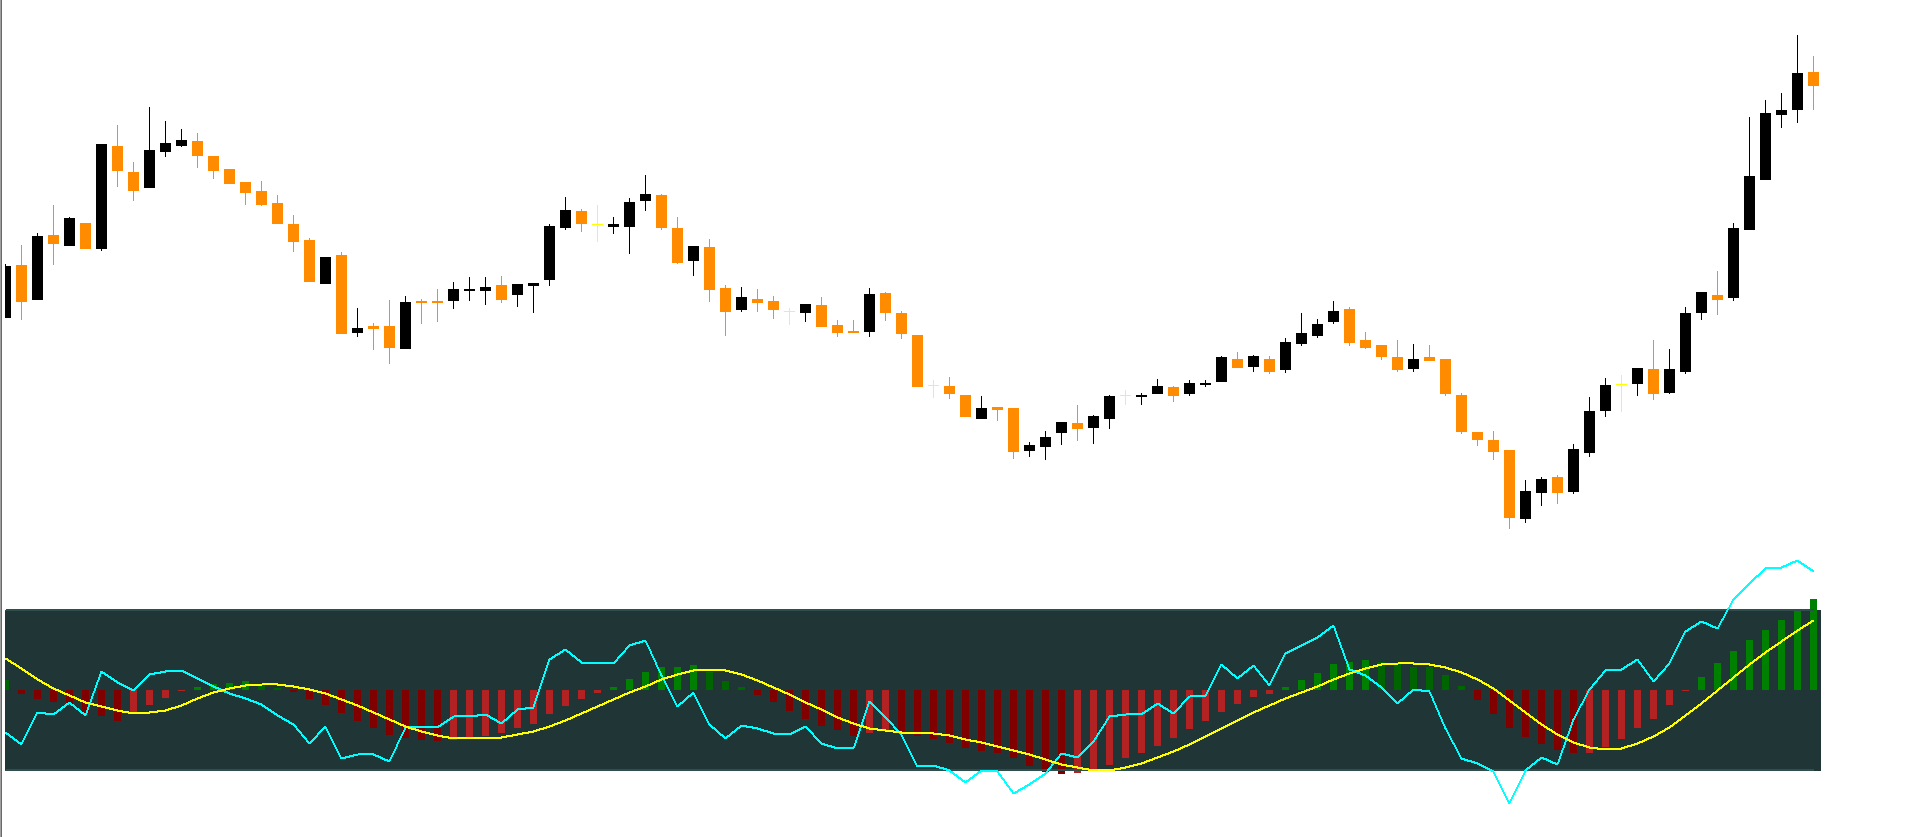
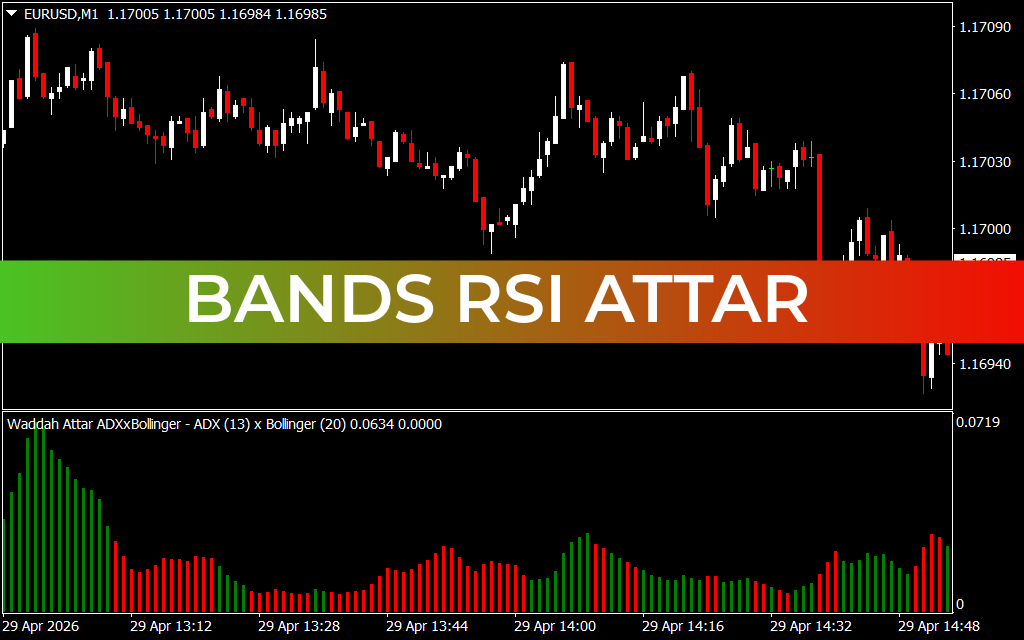
The indicator also comes with histogram bars to show the strength and direction of the market. Green histogram bars indicate bullish trends, while red bars indicate bearish trends. Additionally, it has three RSI lines and two moving averages, which work together to detect optimal buy and sell zones.
How to Use the Improved RSI Signal Indicator
The indicator generates buy or sell signals when the yellow RSI line crosses above or below the aqua RSI line, relative to the zero line. For a sell signal, wait for the red histogram bars to appear, which suggest a bearish move, and then open a sell position when the yellow RSI crosses below the aqua RSI.
To filter false signals, the candlestick should align with the trend direction. For example, a bearish candlestick should close before opening a sell order during a downtrend, while a bullish candlestick should close before entering a buy trade in an uptrend.
Conclusion
The Improved RSI Signal Indicator for MT4 is a forex trading system optimized for identifying Scalping and day/intraday trading opportunities. It provides clear buy and sell signals, highlights market strength and trend direction, and helps traders make informed decisions in volatile financial markets.
FAQ
17 Downloads
Published:
Nov 17, 2025 02:49 AM
Category: