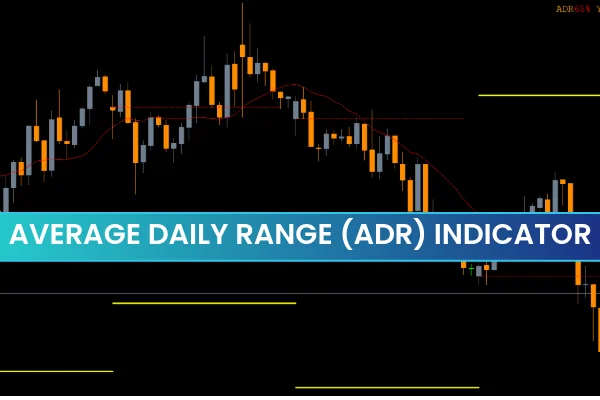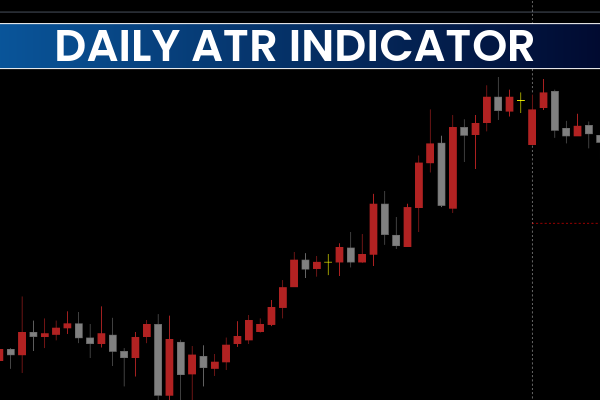
The Daily ATR Indicator measures the daily volatility of any Forex pair or asset. It automatically draws two major levels per day:
ADR High Level: Represents the upper daily ATR level (potential resistance).
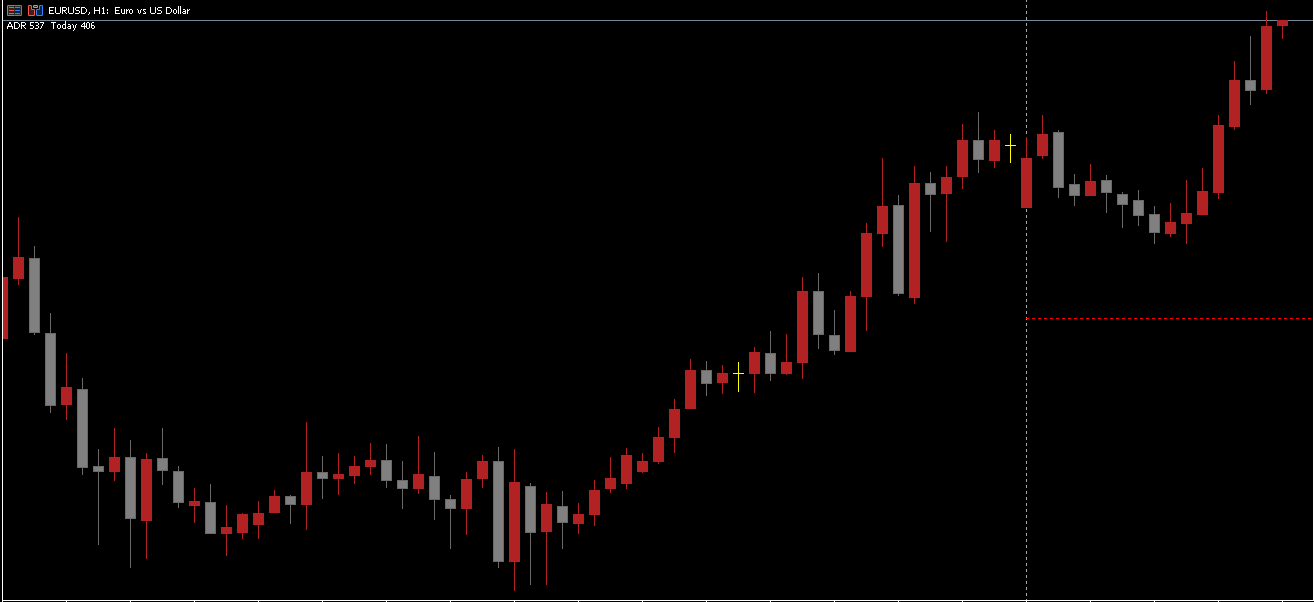
ADR Low Level: Represents the lower daily ATR level (potential support).
These levels form the daily trading range for the selected pair. For instance, if you’re analyzing the GBP/USD on the H1 chart, the indicator shows the highest and lowest ATR levels, helping you understand where price is likely to move during the day.
When price exceeds either the upper or lower ATR level, it signals a strong shift in volatility and market pressure.
Daily ATR Indicator MT5 Trading Setup
The Daily ATR Indicator helps intraday traders plan trades efficiently. Let’s look at how traders typically use it:
A break above the ADR High (red level) indicates strong buying pressure and potential bullish continuation.
A break below the ADR Low (yellow level) indicates strong selling pressure and potential bearish continuation.
The area between ADR High and ADR Low marks the normal daily range where most trading activity occurs.
Traders can use these signals to place entries, set stop losses, and identify potential take profit targets.
How to Trade Using the Daily ATR Indicator
Buy Entry Setup
Wait for price to break above the upper ATR level (ADR High).
Enter a buy position once the breakout candle closes above the level.
Place a stop loss below the ADR Low.
Optionally, take profit at the top of the range or when the opposite signal appears.
Sell Entry Setup
Wait for price to fall below the lower ATR level (ADR Low).
Enter a sell position after a confirmed breakout candle.
Place a stop loss above the ADR High.
Target the bottom of the range or use a trailing stop to lock profits.
Avoid Sideways Markets
If price stays between the ADR levels with no clear breakout, it indicates low volatility and indecision.
Wait for a confirmed break before entering new trades.
Why the Daily ATR Indicator is Best for Intraday Traders
The Daily ATR Indicator for MT5 is especially useful for day traders, as they open and close trades within the same day. The indicator’s clearly defined levels make it easy to:
Identify daily price ranges
Spot breakouts and reversals
Determine stop loss and take profit zones
Measure daily volatility strength
Its visual clarity helps traders avoid overtrading and make more informed decisions.
Conclusion
The Daily Average True Range (ATR) Indicator for MT5 is an excellent tool for determining market volatility and daily trading ranges. It gives traders a clear picture of how far price is likely to move each day, helping them manage entries, exits, and stop losses more effectively.
However, the indicator should not be used as a standalone trading strategy. For best results, combine it with Price Action techniques or other indicators such as MACD or Moving Averages to confirm trade setups.
Whether you’re a beginner or an experienced trader, the Daily ATR Indicator for MT5 is a must-have for improving your intraday trading accuracy.
FAQ
3 Downloads
Published:
Nov 07, 2025 09:08 AM
Category: