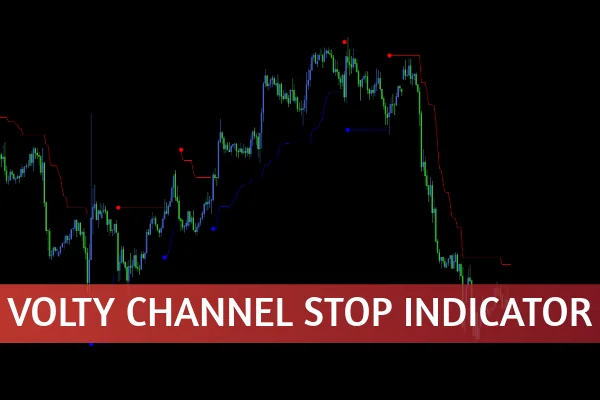
The Volty Channel Stop Indicator for MT5 is a powerful technical tool designed for traders who want to identify potential trend reversals and optimize their entry and exit points in the Forex market. By combining the Average True Range (ATR) and a moving average, this indicator helps traders visualize both market direction and volatility-based reversal zones.
At IndicatorForest.com, you can download the Volty Channel Stop indicator for MetaTrader 5 and integrate it seamlessly into your trading strategy to improve accuracy and timing.
How the Volty Channel Stop Indicator Works
The Volty Channel Stop Indicator for MT5 works by plotting two key components:
Moving Average Line – This line reflects the market’s prevailing direction. When prices stay above the line, it indicates an uptrend, while prices below the line signal a downtrend.
ATR-Based Stop Line – The Average True Range measures volatility. By combining ATR data with the moving average, the indicator generates dynamic stop levels and reversal signals.
These two elements work together to highlight potential buying and selling opportunities. When the price crosses the channel lines, it may signal a shift in momentum or a potential reversal point.
Key Features of the Volty Channel Stop Indicator
Trend Visualization: Instantly shows the direction of the current trend.
Reversal Signals: Detects when momentum weakens and a reversal is likely.
ATR-Based Adjustments: Adapts dynamically to volatility changes in the market.
Clear Buy/Sell Zones: Uses colored dots (blue for buy, red for sell) to mark potential entry and exit levels.
Simple Integration: Compatible with the MetaTrader 5 platform for smooth installation and usage.
How to Trade Using the Volty Channel Stop Indicator
To trade effectively with the Volty Channel Stop Indicator for MT5, follow these general steps:
Identify the Trend Direction
Look at the moving average line. If it’s sloping upward and Price Action remains above it, the market is in an uptrend. Conversely, a downward slope indicates a downtrend.
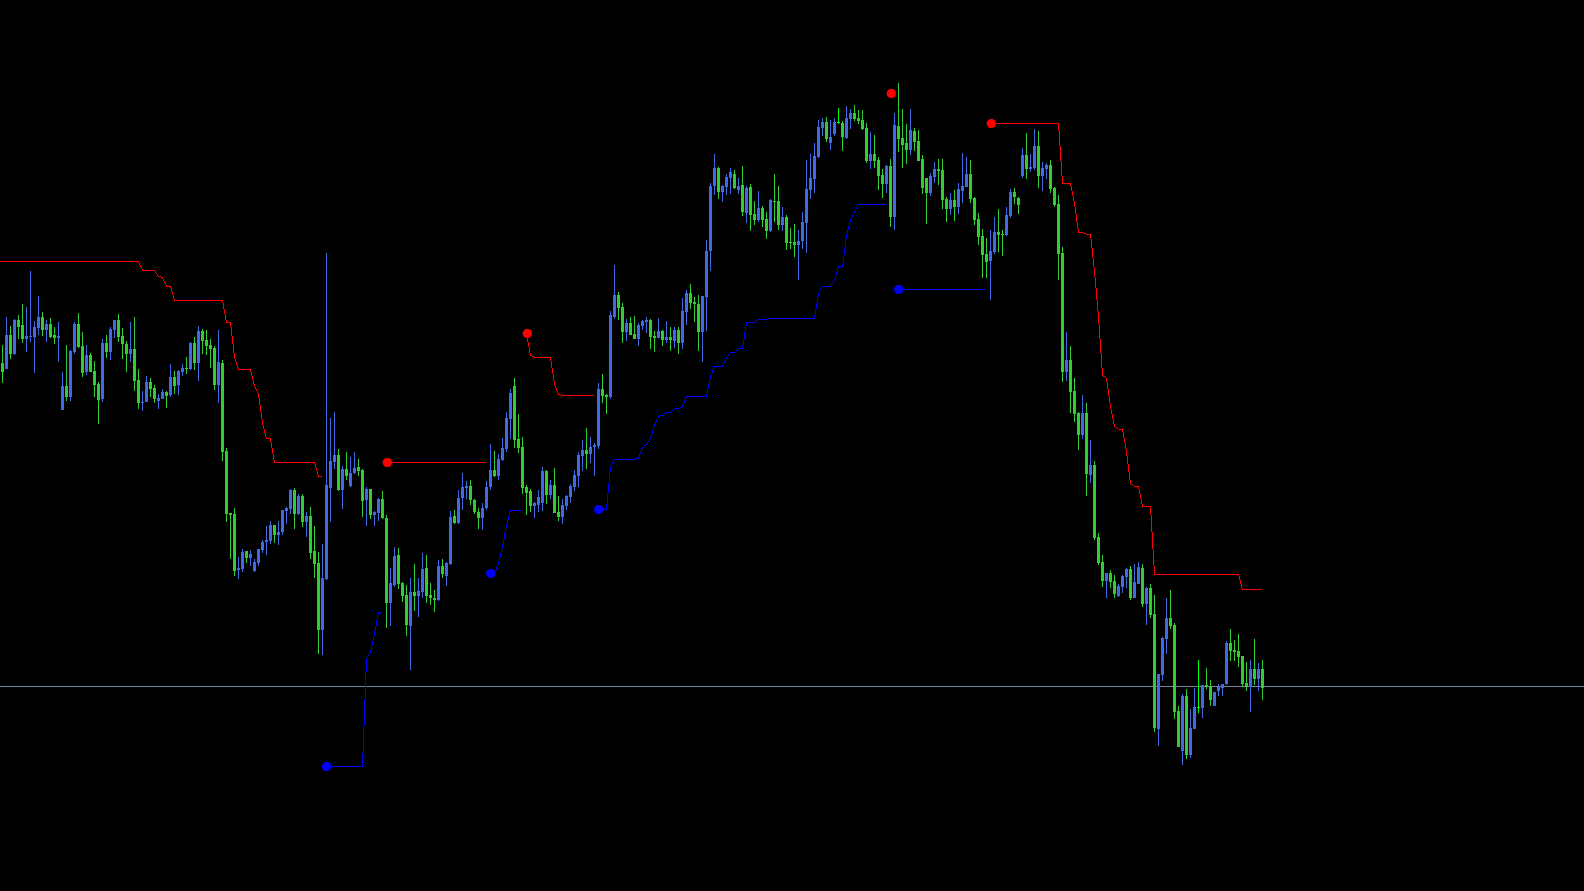
Watch for ATR-Based Dots
Blue Dot = Potential Buy Entry Zone
Red Dot = Potential Sell Entry Zone
These dots appear where the ATR-based calculations suggest a probable reversal or continuation signal.
Confirm with Other Indicators
While the Volty Channel Stop is effective, it should not be used in isolation. Combine it with price action, support/resistance levels, or other technical indicators like RSI or MACD for better accuracy.
Set Stop Loss and Take Profit
Use the ATR-based stop lines to determine stop-loss levels. This approach helps manage risk according to market volatility.
Practical Example
Consider a scenario where the EUR/USD pair is trending upward. The blue dots appear below the price candles, suggesting strong bullish momentum. When the price crosses below the line and a red dot forms, it may indicate a potential Trend Reversal — signaling traders to close long positions or prepare for short entries.
By observing these dynamic signals, traders can make more informed trading decisions and adjust their strategies accordingly.
Best Practices for Using the Volty Channel Stop Indicator
Use it as part of a comprehensive trading plan rather than a standalone decision tool.
Combine with multi-timeframe analysis for stronger confirmation.
Adjust ATR settings to suit different market conditions or instruments.
Regularly backtest your strategy on historical data for improved reliability.
Conclusion
The Volty Channel Stop Indicator for MT5 is a valuable addition to any trader’s toolkit. By combining trend tracking and volatility measurement, it helps identify potential reversal zones and entry opportunities with greater precision.
Download the indicator for free at IndicatorForest.com and start enhancing your Forex trading performance today.
For a more advanced combination strategy, explore our guide on the Best Moving Average Indicators for MT5.
7 Downloads
Published:
Oct 31, 2025 02:56 AM
Category: