The Bsi Trend Indicator for MT5 is a powerful trend-following tool designed to help traders identify the direction and strength of market movements. “BSI” stands for Bar Strength Index, which measures the momentum and pressure behind each price bar.
Unlike standard oscillators, the Bsi Trend Indicator uses colored lines and dynamic channels to visualize market strength. When the line changes color, it signals a shift in momentum—helping traders spot buy and sell opportunities more clearly.
Whether you trade Forex, commodities, or indices, the Bsi Trend Indicator adapts to various timeframes, making it suitable for both intraday and long-term trading strategies.
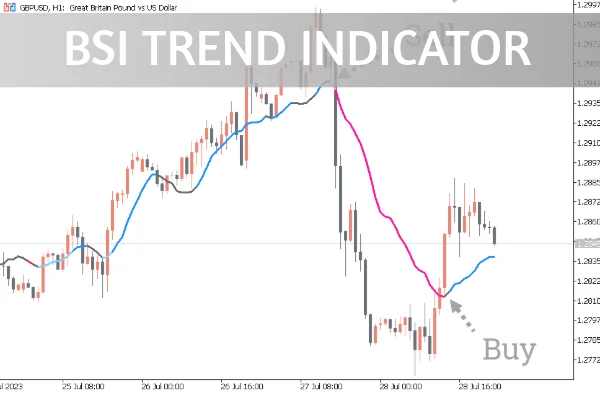
The indicator plots a channel line on your MT5 chart. This line changes color depending on the bar strength and trend direction.
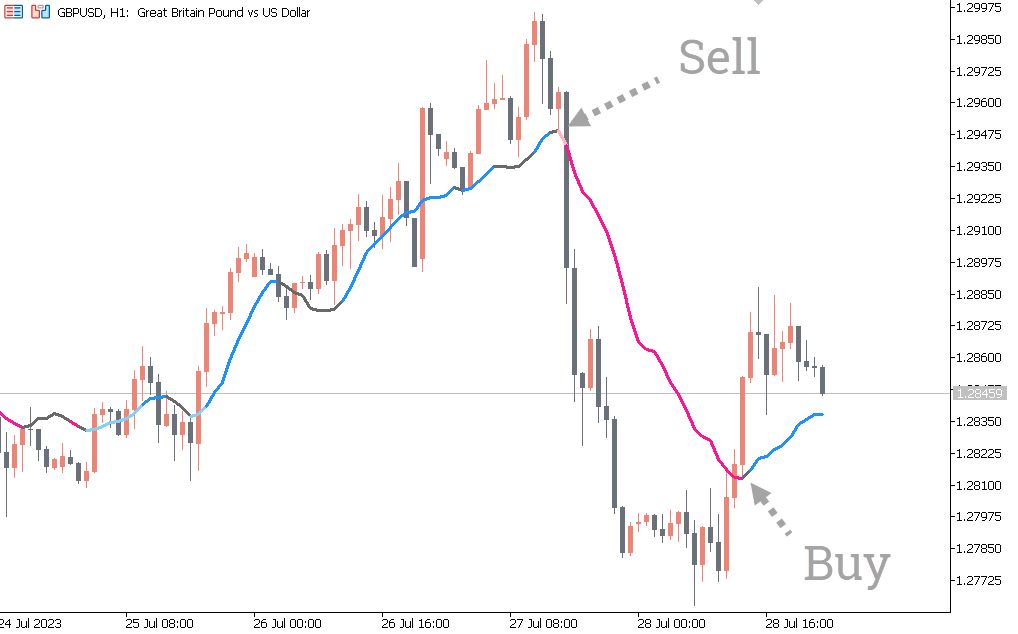
Blue Line – Indicates a bullish trend or buying pressure.
Pink Line – Indicates a bearish trend or selling pressure.
When the price crosses the blue line upward, it’s a potential buy signal. Conversely, when price falls below the pink line, it suggests a sell signal.
This simple visual representation makes it easy to confirm entry and exit points without cluttering your chart.
Consider a GBP/USD H1 chart example:
When the price rises above the blue line, traders can open a long position.
When the price drops below the pink line, traders may open a short position.
For higher accuracy, traders often combine the Bsi Trend Indicator with RSI (Relative Strength Index) or MACD to confirm the trend’s strength before entering a trade.
The term BSI stands for Bar Strength Index, a calculation that measures how strong or weak a bar (or candle) is within a given period.
While the original BSI indicator focuses purely on bar momentum, the Bsi Trend Indicator expands on this concept by integrating trend lines and channels, offering a clearer view of market direction and volatility.
No single indicator can guarantee 100% accuracy. However, certain tools consistently provide better insights into market trends. These include:
Moving Averages (MA) – For smoothing price data.
MACD (Moving Average Convergence Divergence) – For identifying momentum shifts.
RSI (Relative Strength Index) – For detecting overbought or oversold zones.
Bsi Trend Indicator (MT5) – For visualizing bar strength and direction with simplicity.
When combined strategically, these tools can improve your trading precision and profitability.
Simple to use – Clear visual trend signals.
Works on any timeframe – Ideal for day traders and swing traders.
Compatible with other tools – Combine with RSI, MACD, or moving averages for confirmation.
Free download – Available now at IndicatorForest.com.
This indicator is an excellent choice for traders who prefer clean charts, color-based cues, and reliable channel-based trend analysis.
The Bsi Trend Indicator is a versatile MT5 tool that uses multiple trend lines to identify price channels and trend reversals. By following the color changes and line crossings, traders can easily detect buy and sell opportunities.
To enhance accuracy, combine it with supporting indicators like RSI or MACD.
👉 Download the Bsi Trend Indicator for free at IndicatorForest.com and take your trading analysis to the next level.
Published:
Oct 29, 2025 14:04 PM
Category: