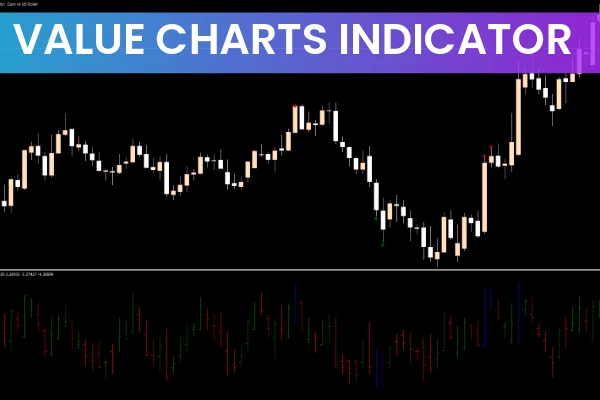
The Value Charts Indicator for MT5 is a powerful tool that helps Forex traders anticipate potential trend reversals by plotting overbought and oversold levels in a separate indicator window. Featuring green and red candles, as well as visual arrows for trading signals, this indicator allows traders to identify the best entry points for buy or sell positions. It’s suitable for both beginners and experienced traders who wish to improve timing and accuracy in their trades.
How the Value Charts Indicator Works
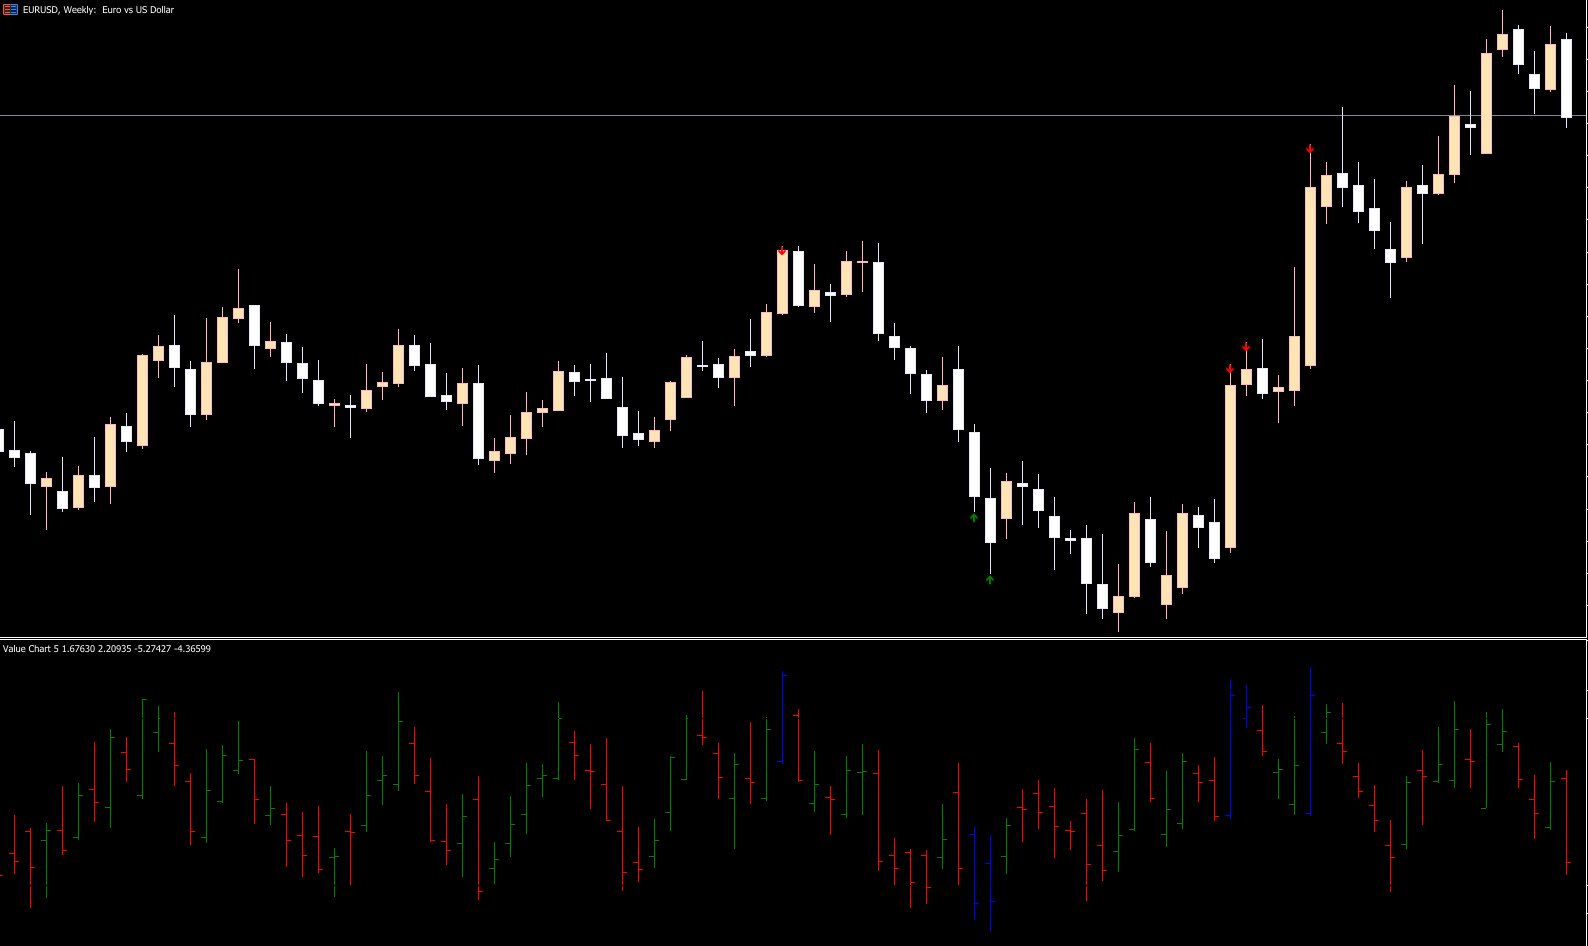
The indicator creates an additional value chart below your main price chart. Key features include:
Green Candles: Bullish market sentiment
Red Candles: Bearish market sentiment
Oversold Level: Red line signaling potential price reversal
Overbought Level: Green line signaling potential trend exhaustion
Trading Arrows: Indicate buy or sell signals based on market conditions
When price reaches these levels, traders can anticipate a reversal and plan trades accordingly.
Trading Signals and Strategy
The Value Charts MT5 Indicator generates signals that must be confirmed with Price Action for optimal results.
Buy Setup
Candles reach the oversold level (red line)
Observe price action to confirm Trend Reversal
Enter a buy trade
Place a stop-loss below the previous swing low
Manage profit using a proper risk-reward ratio, as the indicator does not provide a target
Sell Setup
Candles touch the overbought level (green line)
Confirm reversal through price action
Enter a sell trade
Place a stop-loss above the previous swing high
Set profits using your preferred risk-reward management
Best Practices
Use Value Charts as part of a broader trading strategy.
Combine with other indicators like RSI, MACD, or trend analysis for higher accuracy.
Works on all timeframes—from intraday charts (M1, M15, H1) to daily, weekly, and monthly charts.
Ideal for both beginners learning overbought/oversold trading and advanced traders designing complex strategies.
Conclusion
The Value Charts Indicator for MT5 is a reliable oscillator that visually identifies overbought and oversold conditions, helping traders anticipate trend reversals. While it doesn’t provide exact profit targets, it serves as a powerful tool when used with price action confirmation or other technical indicators. Best of all, it’s free to download and easy to install, making it a must-have addition to your MT5 trading toolkit.
Visit IndicatorForest.com to download the Value Charts Indicator and improve your trading precision today.
FAQ
Published:
Nov 16, 2025 02:55 AM
Category: