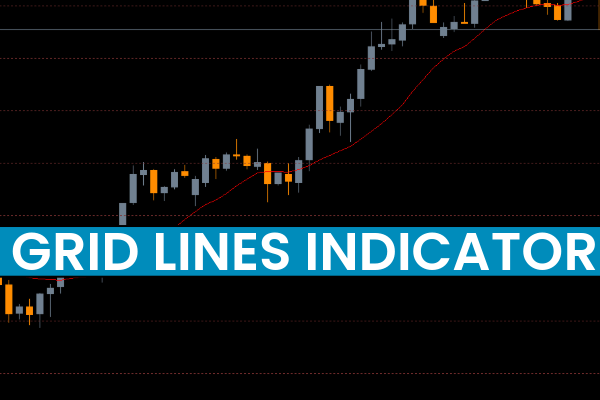
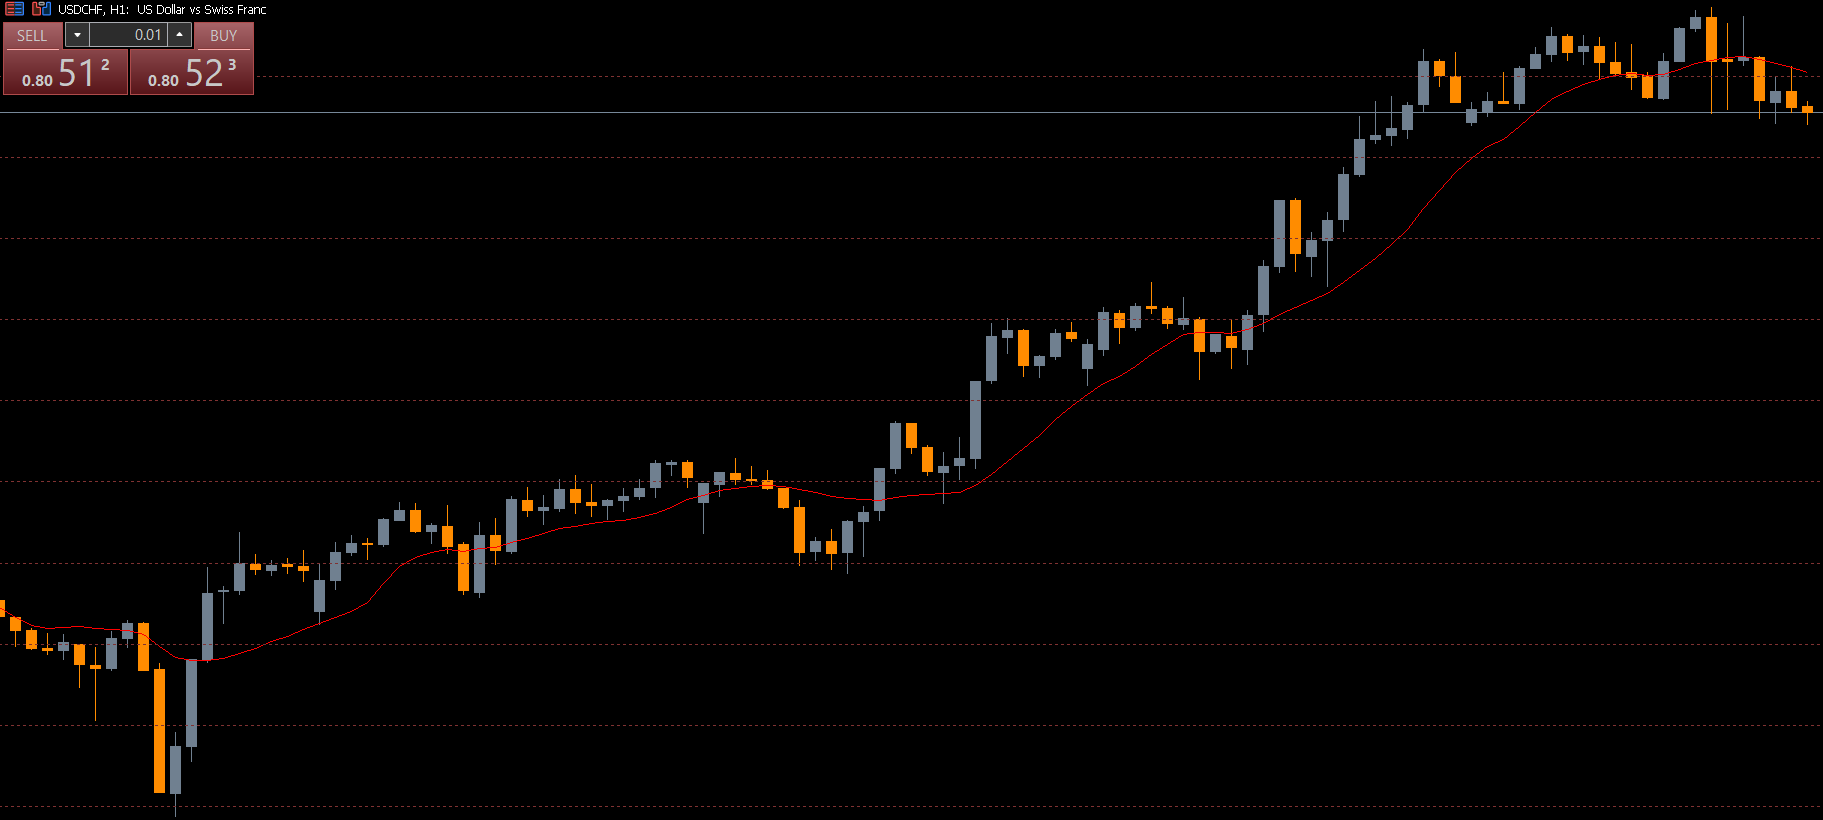
The Grid Lines Indicator MT5 is a simple yet powerful charting tool that automatically plots equidistant horizontal levels on your MetaTrader 5 chart. These grid lines help highlight underlying market conditions that are often invisible to the naked eye. By marking dynamic support, resistance, and psychological price zones, the indicator helps traders identify the best areas to open or close trades.
Whether you are a beginner, intermediate trader, or an advanced breakout trader, the Grid Lines Indicator for MT5 offers excellent clarity in Market Structure and trend reversal zones.
How the Grid Lines Indicator MT5 Works
The indicator plots evenly spaced horizontal lines across the chart. These lines represent potential market reaction levels, making it easier to recognize:
Support zones
Trend Reversal areas
Breakout points
Profit-taking levels
The spacing between the lines—measured in points—can be fully customized. Traders using Scalping, intraday, or positional trading styles can adjust the interval to suit their strategy.
Psychological Price Levels
One of the most important features of the Grid Lines Indicator is the ability to display psychological price levels. These appear as green dotted lines (level 0.00), representing major decision areas where traders typically:
Take profit
Place stop-loss orders
Look for entry confirmations
Manage breakouts or reversals
These zones are crucial because market participants tend to react repeatedly at these key price levels, reinforcing their importance.
Using the Grid Lines Indicator MT5 for Trading
Identifying Trend Reversal Zones
The indicator improves reversal trading by acting as a reference for where price might stall, bounce, or reverse direction. For instance, if the price forms a double bottom or head and shoulders pattern near a grid line, it strengthens the validity of the setup.
Enhancing Breakout Strategies
Breakout traders can use the grid levels as confirmation zones. When price closes beyond a grid line with momentum, the breakout becomes more reliable. Traders can then plan entries, adjust stop-losses, and take profits based on the next key grid level.
Optimizing Trade Entry and Exit Zones
The evenly spaced lines help identify clean and logical trade levels, such as:
Retest areas
Pullback zones
Swing highs/lows
Consolidation boundaries
The visual clarity offered by the indicator eliminates guesswork and enhances confidence in decision-making.
Customizable Spacing for Any Trading Style
Scalpers may use tighter spacing (10–20 points).
Day traders may set wider grids (50–100 points).
Swing traders may use even wider spacing (100–300 points).
This flexibility makes the indicator suitable for all market conditions.
Benefits of the Grid Lines Indicator MT5
Easy to use for traders at all skill levels
Highlights hidden market structure
Serves as dynamic Support And Resistance
Improves breakout and reversal trading
Fully customizable interval settings
Helps plan stop-loss, take-profit, and entry levels
Works on all MT5 timeframes and instruments
Conclusion
The Grid Lines Indicator MT5 is a highly effective yet simple tool for improving trade precision and understanding price behavior. By mapping out actionable horizontal zones across the chart, traders gain a clearer view of the market’s structure and potential decision points.
You can download the Grid Lines Indicator for MT5 for free at IndicatorForest.com and start enhancing your trading setup today.
FAQ
5 Downloads
Published:
Nov 20, 2025 14:49 PM
Category: