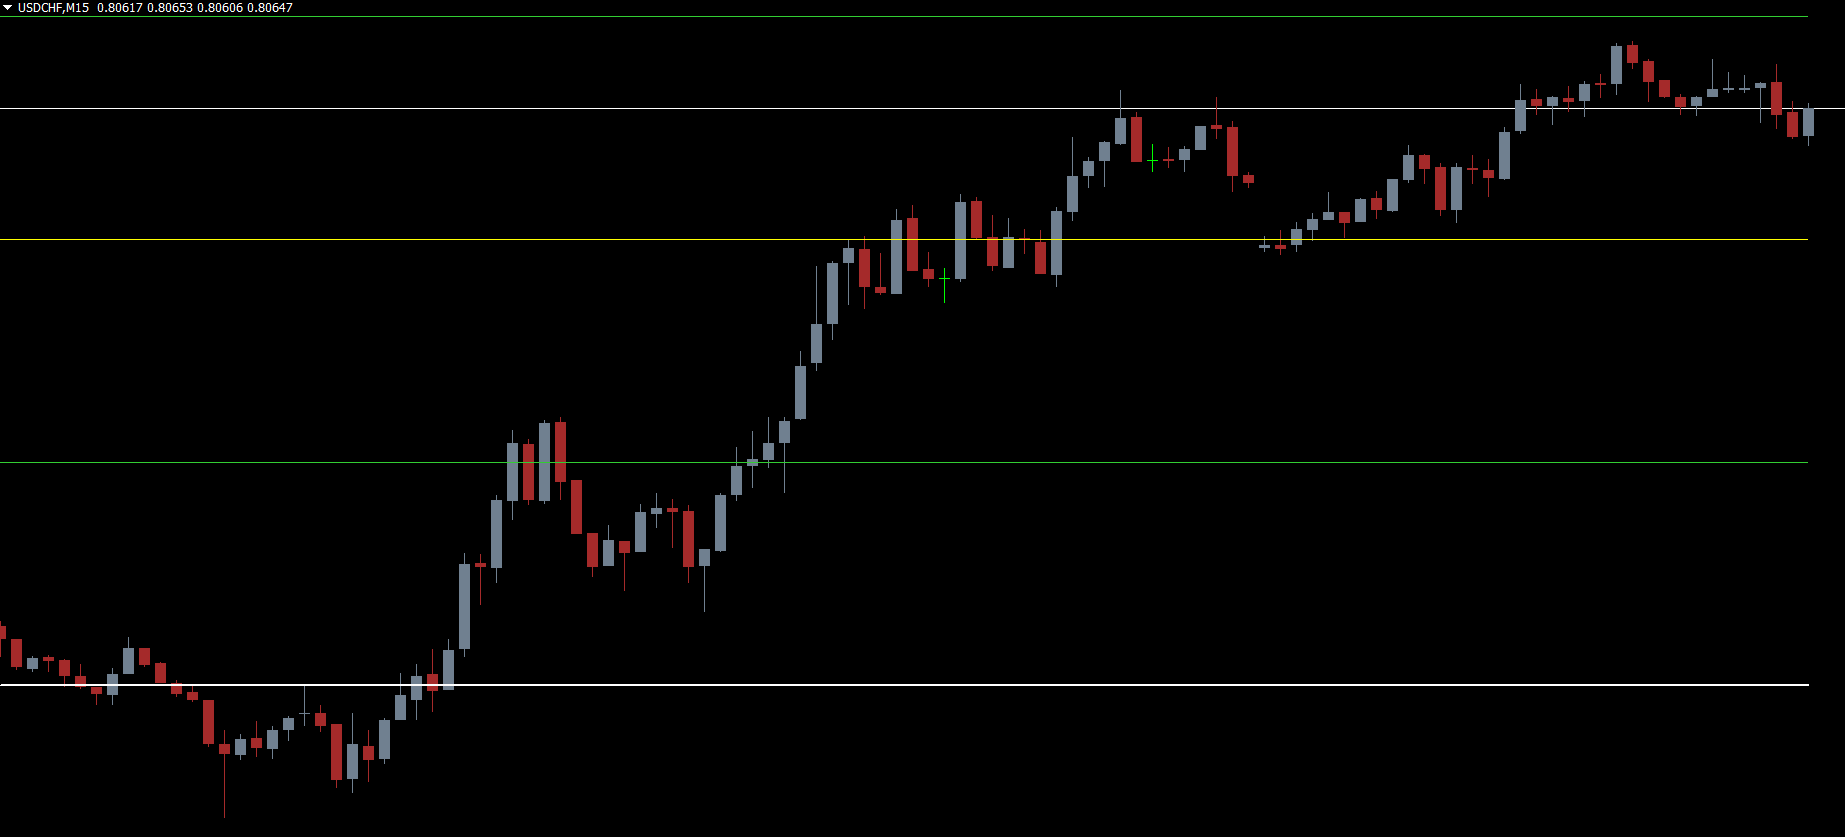
The Range Indicator MT5 helps traders measure market volatility, identify price expansion or contraction, and enhance trading decisions with accurate range analysis.

Range Indicator MT5: A Complete Guide to Market Volatility Analysis
The Range Indicator MT5 is a powerful volatility-based tool that helps traders analyze the average price movement of any asset. Instead of following trends, the indicator focuses purely on market volatility, enabling traders to understand how strongly or weakly prices are moving. Volatility plays a major role in determining market sentiment, breakout strength, and suitable entry or exit zones. The Range Indicator makes this analysis simple by converting complex price dynamics into easily readable charts.
The Range Indicator is designed to show the rise or fall of volatility in the market. It calculates the average price range using internal variables that track hidden market dynamics—details that cannot be observed with the naked eye. These values allow the indicator to automatically determine the strength of price movement in real time.
The tool primarily works with market highs and lows, calculating ranges such as:
Current high minus previous low
Current close minus previous high
Current high minus previous close
Using these calculations, the indicator draws a continuous bar or histogram that expands when volatility increases and contracts when volatility weakens. This gives traders a visual understanding of how aggressively or calmly the market is moving.
Volatility is often underestimated by new traders, but it heavily influences:
Breakout strength
Stop-loss and take-profit placement
Position sizing
Trend continuation or reversal
Risk management
The Range Indicator MT5 provides traders with early insight into whether the market is entering a high-volatility expansion phase or a quiet consolidation period. This helps traders prepare for future price movements instead of reacting late.
When the Range Indicator expands sharply, it signals increasing volatility. This often precedes:
Trend breakouts
Momentum pushes
Strong directional moves
Traders can combine the indicator with support and resistance levels to confirm whether a breakout is likely to continue.
If the indicator contracts and displays smaller bars, it indicates a quiet market. These periods often appear before major breakouts. Traders can prepare for upcoming moves by:
Identifying consolidation zones
Watching for price compression
Planning pending buy/sell orders
A higher range reading suggests that price movement is stronger and wider, so stop-losses should be slightly larger.
A lower range reading suggests tighter movement, allowing for smaller stop-losses.
This makes the Range Indicator a valuable tool for dynamic risk management.
While the indicator does not follow trends, it confirms their intensity:
Rising ranges → strong trend momentum
Falling ranges → weakening trend
Flat ranges → sideways market
This helps traders avoid entering weak or exhausted trends.
The Range Indicator MT5 is an excellent tool for traders who depend on market volatility analysis. It simplifies the complex calculations behind market dynamics and provides a clear picture of price strength, breakout potential, and trend momentum. Whether you trade forex, commodities, indices, or cryptocurrencies, this indicator will help you make more informed decisions.
For more indicators, trading tools, and professional guides, visit IndicatorForest.com today.
Published:
Nov 20, 2025 09:45 AM
Category: