The Fractal Trend Indicator for MT4 is a powerful forex trading tool that automatically plots dynamic trend lines based on fractals. These fractal trend lines serve as Support And Resistance zones, giving traders clear visual cues for buy and sell opportunities. Whether you are a beginner or an experienced trader, this indicator helps simplify your market analysis by automatically detecting critical turning points on the chart.
Unlike manual drawing tools, the Fractal Trend Indicator MT4 continuously updates itself as new price data forms. This ensures your analysis always reflects current market conditions without constant redrawing or guesswork.
How the Fractal Trend Indicator Works
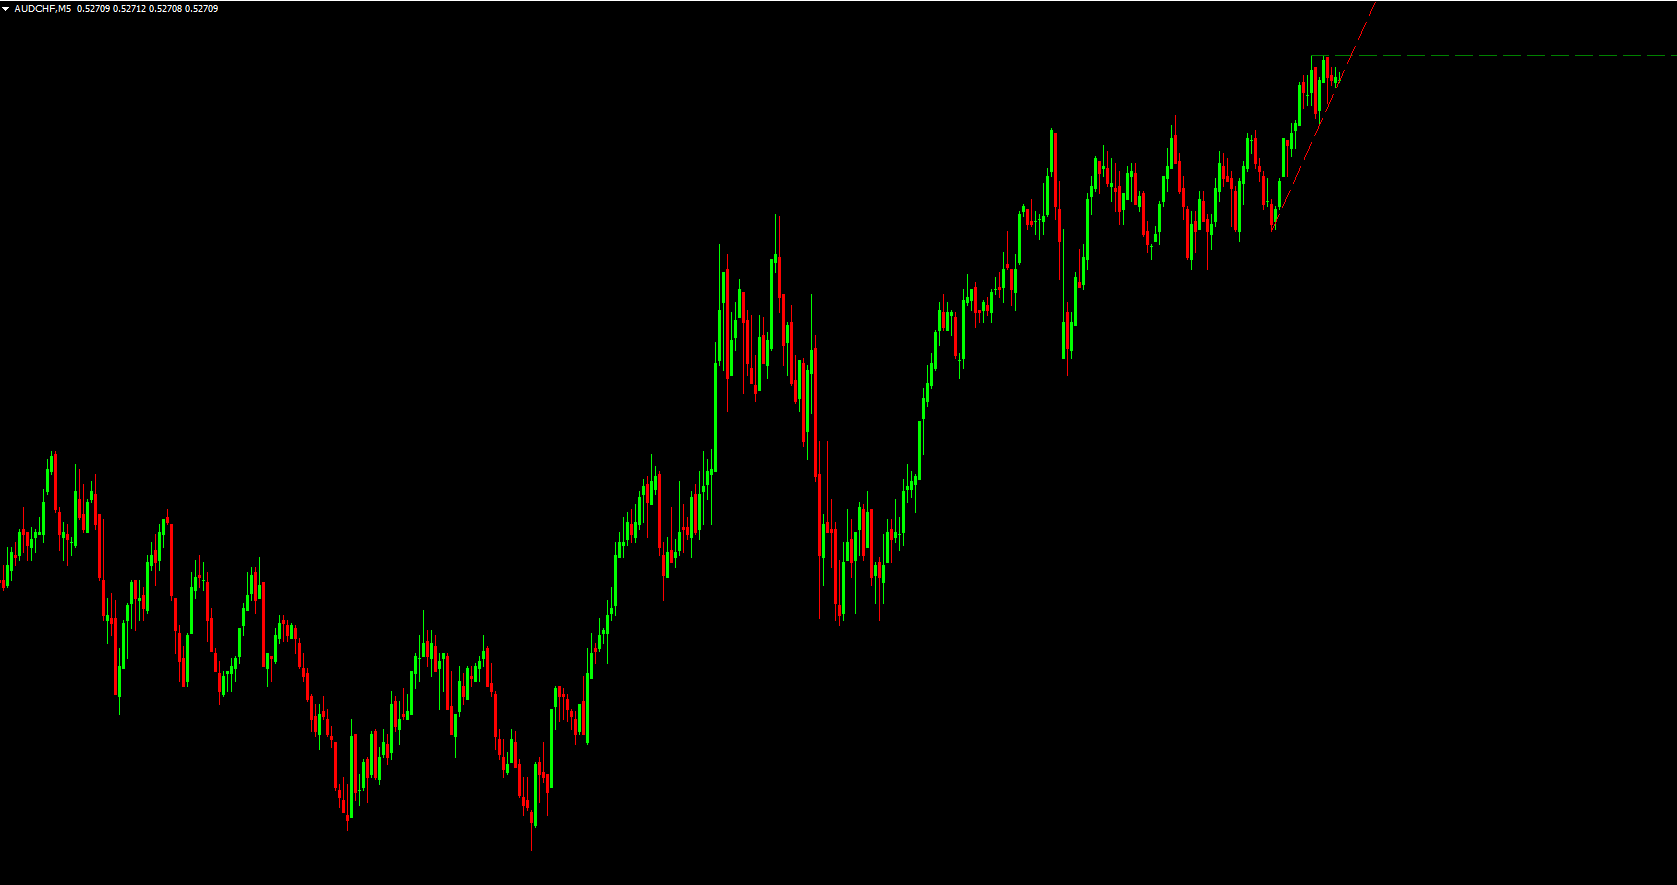
The Fractal Trend Indicator for MetaTrader 4 identifies local highs and lows in the market, known as fractals. Once detected, it connects these fractal points to create trend lines.
Green lines represent upper trend lines (resistance zones).
Red lines represent lower trend lines (support zones).
These lines act as dynamic support and resistance levels, allowing traders to anticipate potential price reversals or breakouts. Users can also customize the colors, thickness, and styles of the lines from the indicator settings for better chart visibility.
Using the Fractal Trend Indicator for Trading Signals
As shown in the EURUSD H1 example, the Fractal Trend Indicator MT4 offers two main trading strategies:
Range Trading Strategy
When price moves between the upper resistance and lower support fractal lines, traders can buy near support and sell near resistance. This strategy works well in sideways markets where price bounces between levels.
Breakout Trading Strategy
When price breaks above the resistance line, it signals a potential uptrend continuation. This is a strong buy signal.
Conversely, when price breaks below the support line, it indicates bearish momentum, signaling a sell opportunity.
The indicator adapts to multiple time frames, allowing traders to apply multi-time-frame (MTF) strategies. For example, plotting fractals from a higher time frame (like H4) can help identify strong long-term levels while trading on a shorter chart (like M15).
Why Use the Fractal Trend Indicator for MT4?
Here are some key advantages:
Automatic plotting of support and resistance levels.
Easy to use for both beginners and experts.
Compatible with any forex pair or timeframe.
Reduces manual chart analysis time.
Works well with range and breakout trading systems.
By providing a clear Market Structure, this indicator helps traders make more informed decisions and improve entry and exit accuracy.
Tips for Best Results
To maximize performance with the Fractal Trend Indicator for MT4, traders can:
Combine it with momentum indicators like RSI or MACD for confirmation.
Use higher-time-frame fractals for identifying major trend directions.
Avoid trading against dominant trends unless strong reversal signals appear.
Conclusion
The Fractal Trend Indicator for MT4 is a valuable addition to any trader’s toolkit. It automatically identifies and draws fractal-based support and resistance trend lines, helping you capture breakout and range trading opportunities more efficiently.
If you’re looking to enhance your chart analysis with precision and automation, download the Fractal Trend Indicator for MT4 today from IndicatorForest.com and experience smarter trading decisions.
5 Downloads
Published:
Nov 02, 2025 23:56 PM
Category: