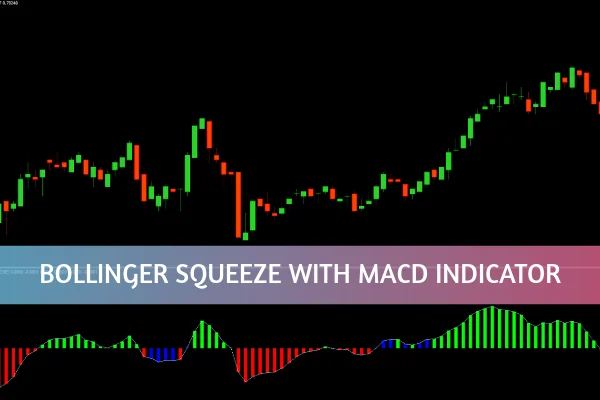
The Bollinger Squeeze with MACD Indicator is a highly effective trading tool that blends two of the most respected technical analysis methods: Bollinger Bands and MACD (Moving Average Convergence Divergence).
This combination allows traders to pinpoint periods of low volatility (squeezes) and potential breakouts, while confirming the direction of market momentum. Whether you’re new to trading or an experienced investor, this indicator helps refine your entries and exits, leading to more precise and confident decisions.

The Bollinger Bands measure market volatility by plotting standard deviations around a moving average. When the bands tighten, it signals a volatility squeeze, meaning that price movement has slowed down and a strong breakout may be imminent.
Narrow bands = low volatility
Widening bands = high volatility / breakout
During a squeeze, traders anticipate a significant move, but the direction remains uncertain. That’s where the MACD adds confirmation.
The MACD measures momentum and trend strength. It does this through two lines — the MACD line and the signal line — and a histogram that visualizes momentum changes.
When combined with the Bollinger Squeeze, the MACD helps confirm breakout direction:
A buy signal forms when the MACD line crosses above the signal line during a squeeze.
A sell signal occurs when the MACD line crosses below the signal line.
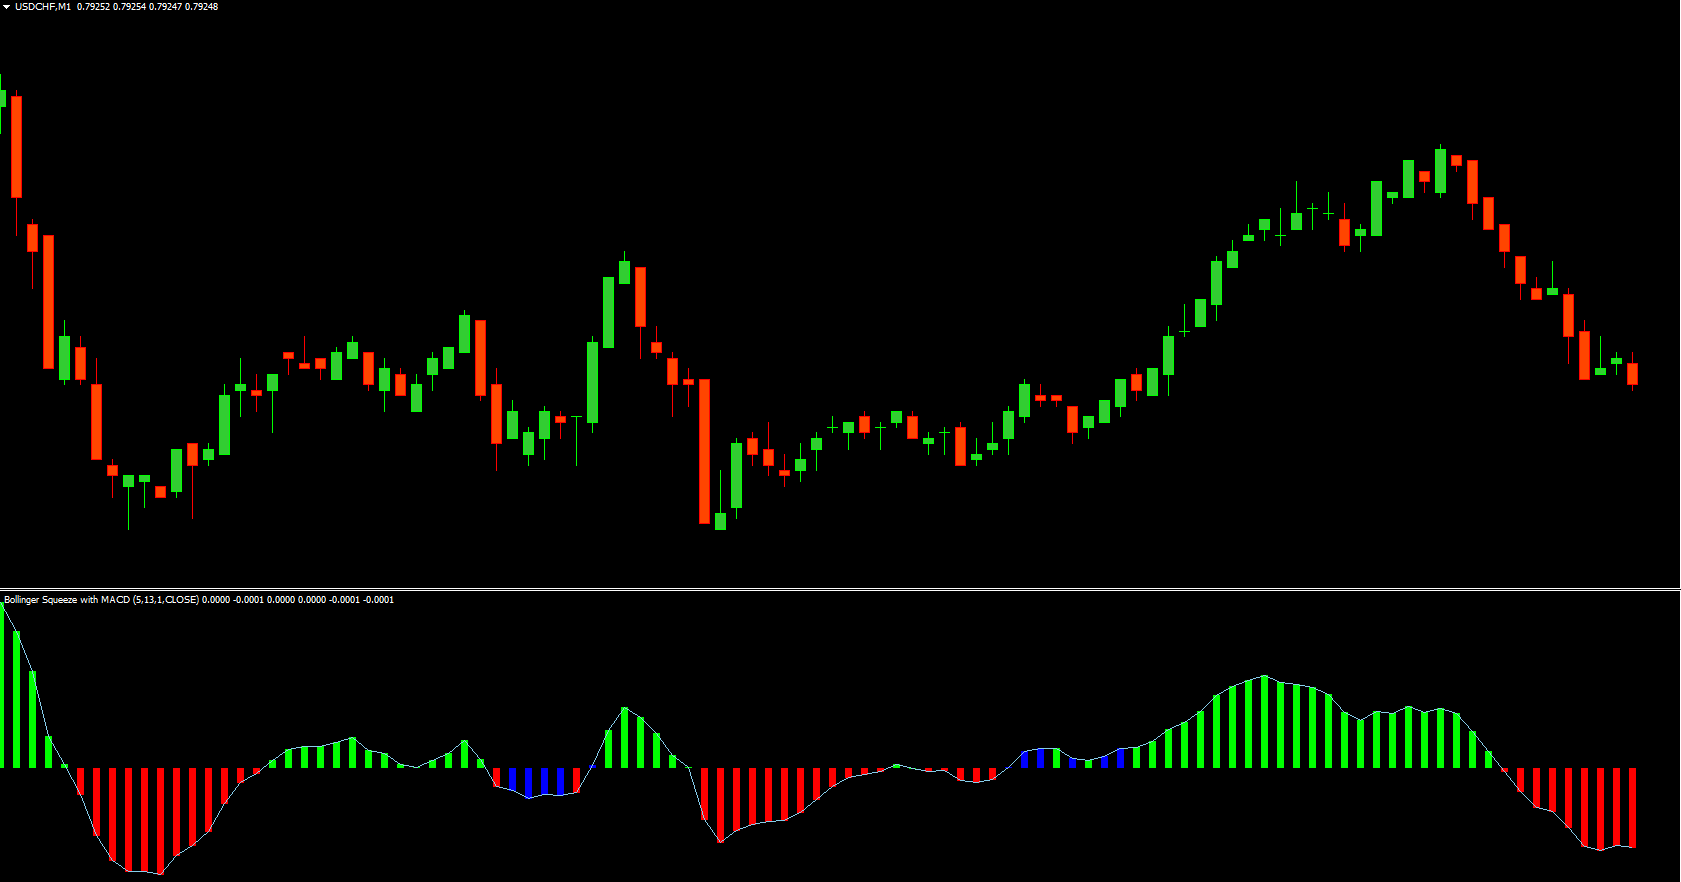
The histogram’s colors further assist traders:
Green bars indicate bullish momentum.
Red bars signal bearish pressure.
Blue bars show indecision or neutral momentum.
This dynamic pairing gives traders a clearer picture of both volatility and momentum, improving decision-making accuracy.
This indicator generates signals based on the combination of volatility and momentum shifts.
During low volatility periods, the Bollinger Bands contract, forming a “squeeze.”
When volatility expands, a breakout typically follows.
The MACD provides momentum confirmation, showing whether the breakout is bullish or bearish.
This dual-confirmation approach helps traders filter false signals and enter trades only when both indicators align, reducing risk and increasing reward potential.
✅ High accuracy: Combines two proven analytical methods.
📈 Momentum confirmation: Identifies the strength and direction of market moves.
🧭 Versatile: Works across multiple timeframes and assets (forex, stocks, crypto).
💡 Visual clarity: Color-coded histogram and clear crossovers simplify interpretation.
⚙️ Customizable settings: Adjust sensitivity to suit different trading strategies.
By mastering this indicator, traders gain a strategic advantage in recognizing breakout opportunities before they happen.
Combine it with support and resistance levels for higher probability setups.
Avoid trading immediately after the squeeze ends; wait for MACD confirmation.
Use proper risk management and stop-loss placement below key levels.
Backtest different timeframes to find the most reliable signals for your strategy.
For a hands-on experience, download the Bollinger Squeeze with MACD Indicator directly from IndicatorForest.com and test it on your preferred trading platform.
The Bollinger Squeeze with MACD Indicator combines the analytical depth of Bollinger Bands with the momentum-tracking precision of MACD. Together, they form a reliable, easy-to-use system that enhances your ability to spot breakout opportunities and ride strong trends confidently.
Start improving your trading accuracy today — visit IndicatorForest.com to explore more innovative indicators designed to help you trade smarter, not harder.
Published:
Oct 19, 2025 02:57 AM
Category: