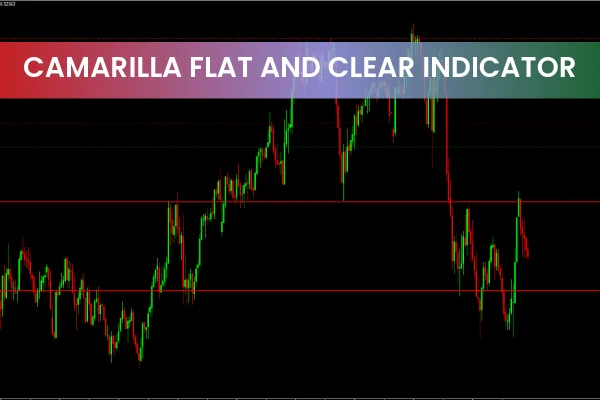
The Camarilla Flat and Clear indicator is a MetaTrader 4 (MT4) tool designed to display crucial pivot points where price reversals or breakouts are most likely. By plotting lines based on the previous day’s highs, lows, and closing prices, this indicator helps traders identify significant Support And Resistance zones. Whether you are a beginner or an experienced trader, the Camarilla indicator provides a clear framework for anticipating market movements.
How the Camarilla Indicator Work
The indicator calculates pivot levels derived from prior Price Action. These horizontal lines act as reference points for potential trend reversals or breakout opportunities. Traders often monitor these levels closely because price tends to react strongly when approaching these critical zones.
Are Camarilla Pivot Points Accurate?
Yes, Camarilla pivot levels are considered reliable for trend analysis. These levels represent historical price action zones, meaning the market often respects them. For example, when the price nears a green line, a bullish breakout may occur, while a red line could indicate a bearish reversal. This makes the indicator a practical tool for both short-term Scalping and long-term trend trading strategies.
Features of the Camarilla Flat and Clear Indicator
Color-coded lines: Green and red lines indicate key bullish and bearish zones, while the maroon line represents the centerline for balance reference.
Customizable settings: Users can assign preferred colors to any horizontal lines for better clarity.
User-friendly interface: Designed to be accessible for all traders, even those new to MT4.
Benefits of Using the Camarilla Indicator
Displays Reliable Support and Resistance Zones
The horizontal lines provide strong support and resistance areas derived from previous highs, lows, and closing prices. This allows traders to make informed decisions when planning entries and exits.
Trend Identification
The indicator not only marks pivotal levels but also helps identify trend direction. A breakout above the green line suggests a bullish trend, while a drop below the red line signals a bearish trend. This dual functionality makes the Camarilla indicator invaluable for market analysis.
Conclusion
The Camarilla Flat and Clear indicator is a versatile MT4 tool for traders looking to anticipate trend reversals and breakouts. By combining past price action with clear pivot point visualization, it simplifies trading decisions and improves accuracy. For detailed guides, setups, and expert tips, visit IndicatorForest.com today.
1 Download
Published:
Nov 04, 2025 11:45 AM
Category: