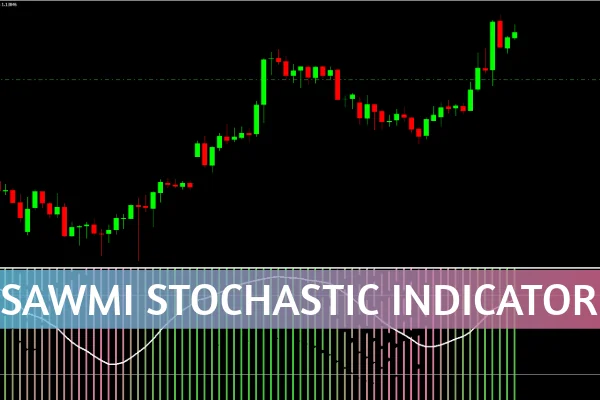
The Swami Stochastic Indicator for MT4 is a powerful forex trading tool designed to help traders identify overbought and oversold conditions with added visual clarity. Unlike the traditional stochastic oscillator, this indicator includes a color-coded heat map that makes it easy to distinguish between bullish and bearish market conditions at a glance. Whether you’re a beginner or an experienced trader, this indicator can enhance your decision-making and improve your overall trading strategy.
The Swami Stochastic is a custom technical analysis indicator built for the MetaTrader 4 (MT4) platform. It enhances the traditional stochastic oscillator by adding a heat map layer beneath the main stochastic line.
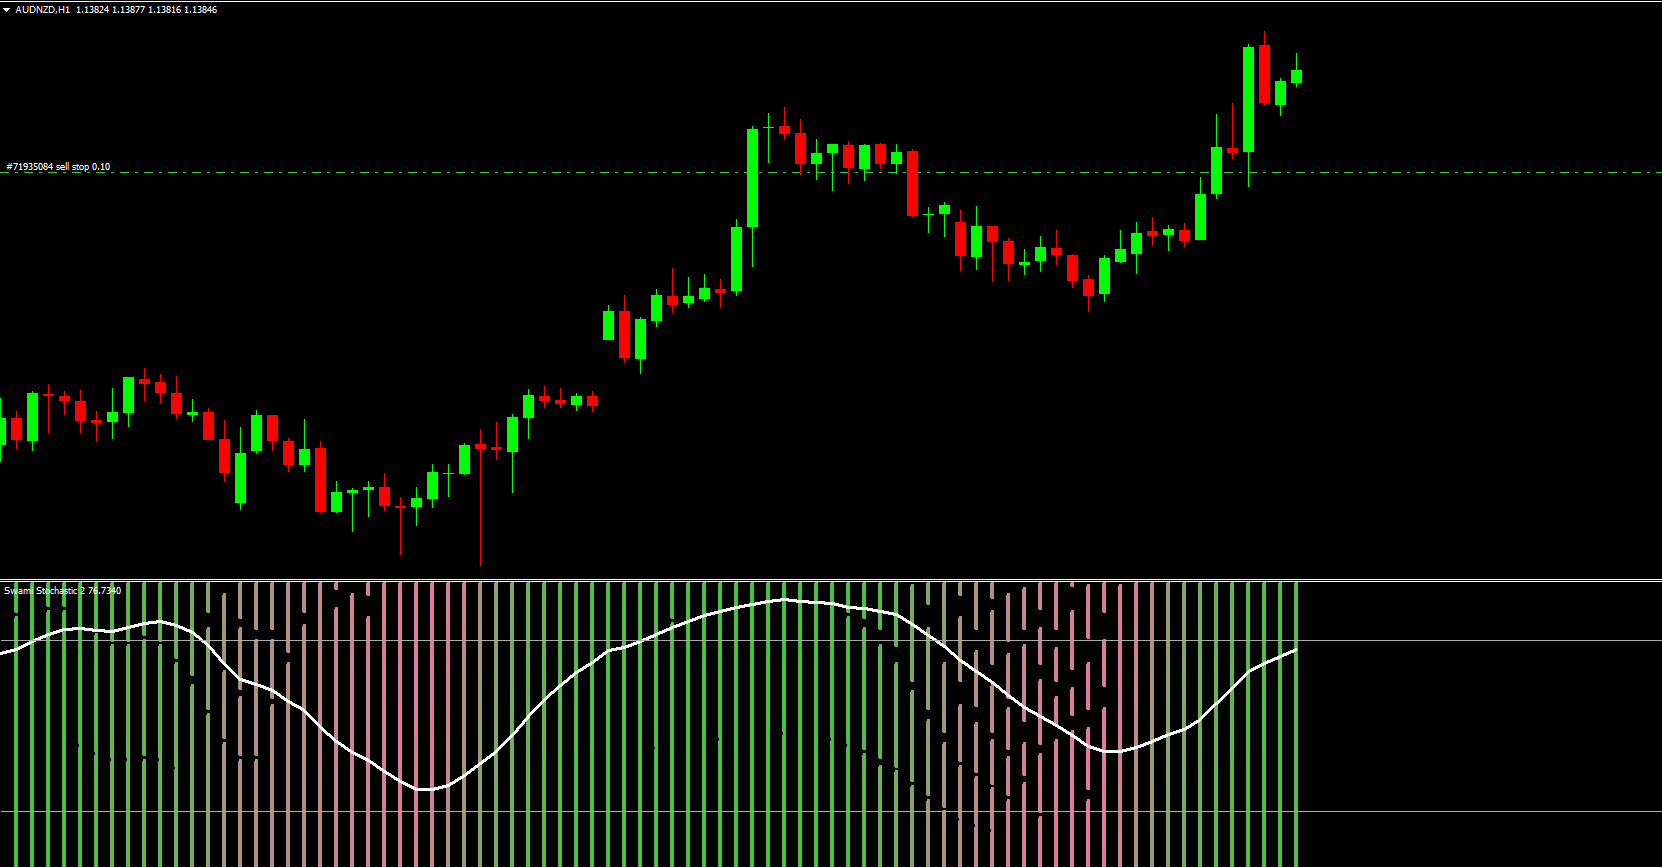
This heat map visually represents the strength of market trends:
Lime Green indicates a bullish market condition.
Pink signals a bearish market phase.
This simple yet effective visualization enables traders to quickly identify market sentiment without relying solely on price movements or multiple chart indicators.
The Swami Stochastic Indicator for MT4 operates by combining multiple stochastic periods to measure momentum and trend strength. It oscillates between 0 and 100, marking key levels at 20 and 80:
Below 20: The market is oversold, and a potential reversal to the upside may occur.
Above 80: The market is overbought, signaling a possible downside reversal.
In addition to the traditional stochastic line, the heat map enhances clarity by instantly showing whether bulls or bears are dominating the market.
Watch for the indicator to drop below the 20 level and then reverse upward past 20.
The heat map should turn lime green, confirming bullish momentum.
Place your stop loss below the recent swing low.
Exit the position when the stochastic value rises near or above 80.
Wait for the indicator to move above the 80 level and then turn downward.
Confirm the bearish bias when the heat map changes to pink.
Set your stop loss above the latest swing high.
Exit when the stochastic value moves close to or below 20.
This method helps traders capitalize on momentum shifts while maintaining strong risk management practices.
The integrated heat map provides an instant visual cue of trend direction and market bias.
It performs well on any MT4 chart timeframe, from 1-minute scalping to long-term trading setups.
Both new and advanced traders can benefit from its intuitive interface and clear trading signals.
While not ideal for strong trending conditions, this indicator excels in sideways or consolidating markets, where reversals are common.
Although the Swami Stochastic Indicator is highly reliable, traders should avoid using it alone in strongly trending markets. Combining it with a trend confirmation tool such as a Moving Average or ADX indicator can improve accuracy.
For example, when the trend is strong, a sell signal above 80 may fail if the overall market momentum remains bullish. Thus, integrating other confirmation tools is recommended for better precision.
The Swami Stochastic Indicator for MT4 is an innovative and visually enhanced version of the classic stochastic oscillator. Its heat map feature simplifies the process of identifying bullish and bearish conditions, making it a must-have tool for forex traders looking to improve their technical analysis.
Download and explore the Swami Stochastic Indicator for MT4 at IndicatorForest.com to experience more precision and clarity in your trading journey.
Published:
Oct 28, 2025 14:45 PM
Category: