The Dolly Graphics v11 GMT Shift Indicator is a powerful trading tool designed to help traders identify buy and sell zones effectively. By leveraging pivot points and historical price levels, this MT5 indicator allows traders to spot potential market turning points, enhancing decision-making in volatile markets. Whether you are a beginner or an experienced trader, understanding how to use this indicator can significantly improve your trading strategy.
H2: What is the Dolly Graphics v11 GMT Shift Indicator?
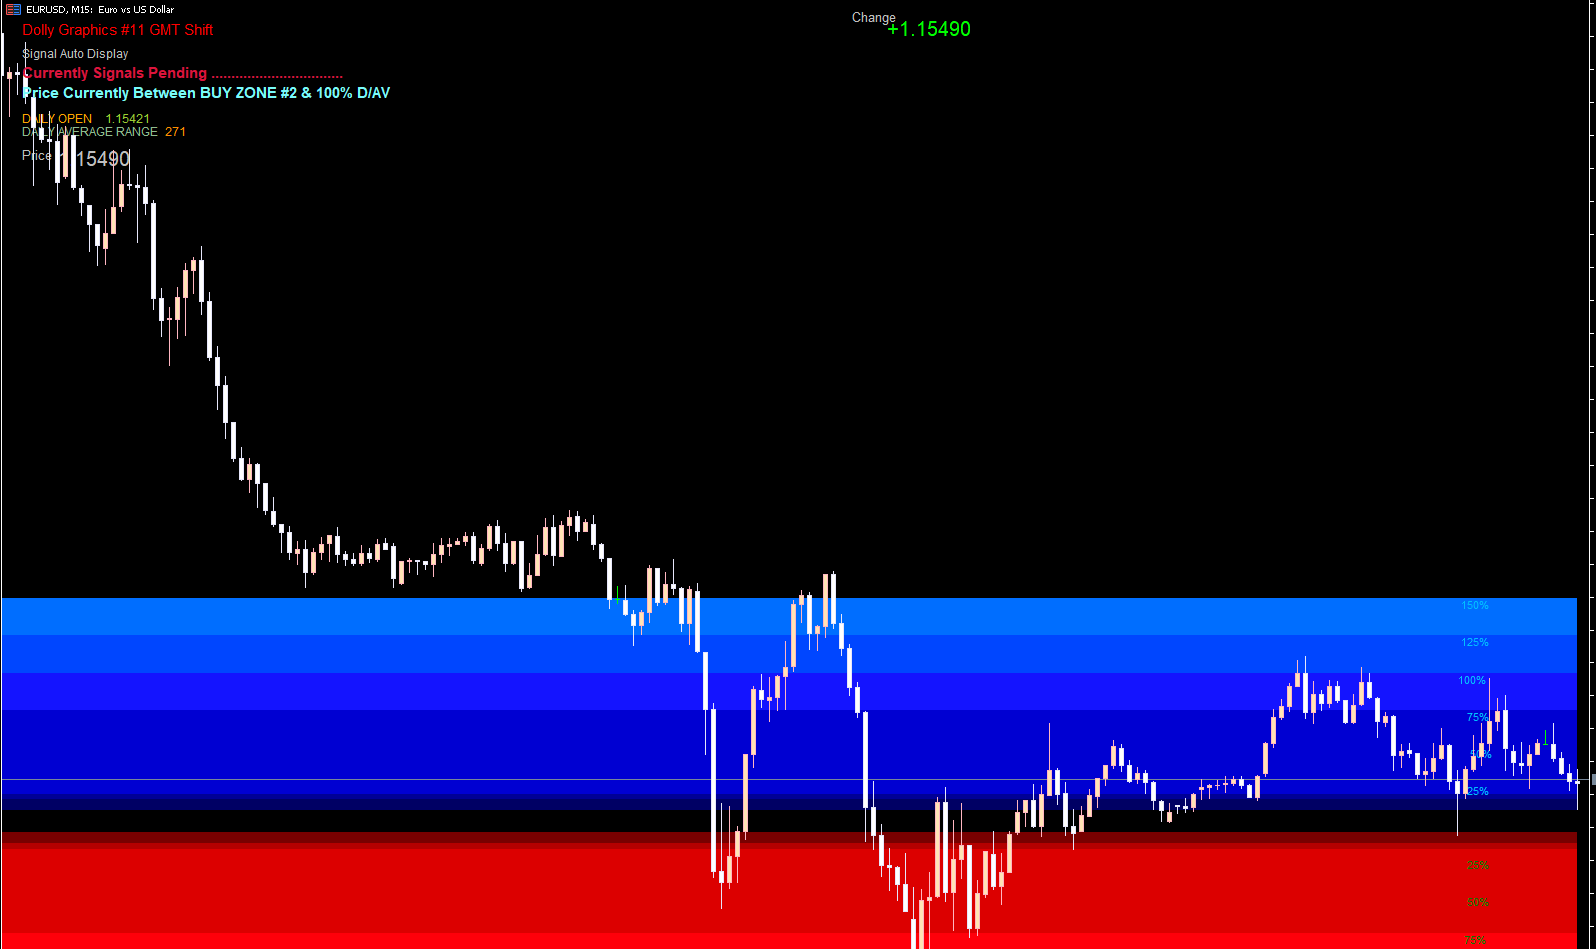
The Dolly Graphics v11 GMT Shift Indicator is a turn-based indicator that calculates pivot points from previous highs, lows, and closing prices. These pivot points act as Support And Resistance levels, providing a clear picture of market structure. The indicator also factors in GMT zone shifts, daily open, and daily range, giving traders additional context for precise entries and exits.
Key Features of the Indicator
Pivot Points and Key Levels
Pivot points are central to the Dolly Graphics v11 GMT Shift Indicator. These levels help identify potential price reversals and continuation zones. By using historical highs, lows, and closing prices, the indicator calculates key levels where price may encounter support or resistance.
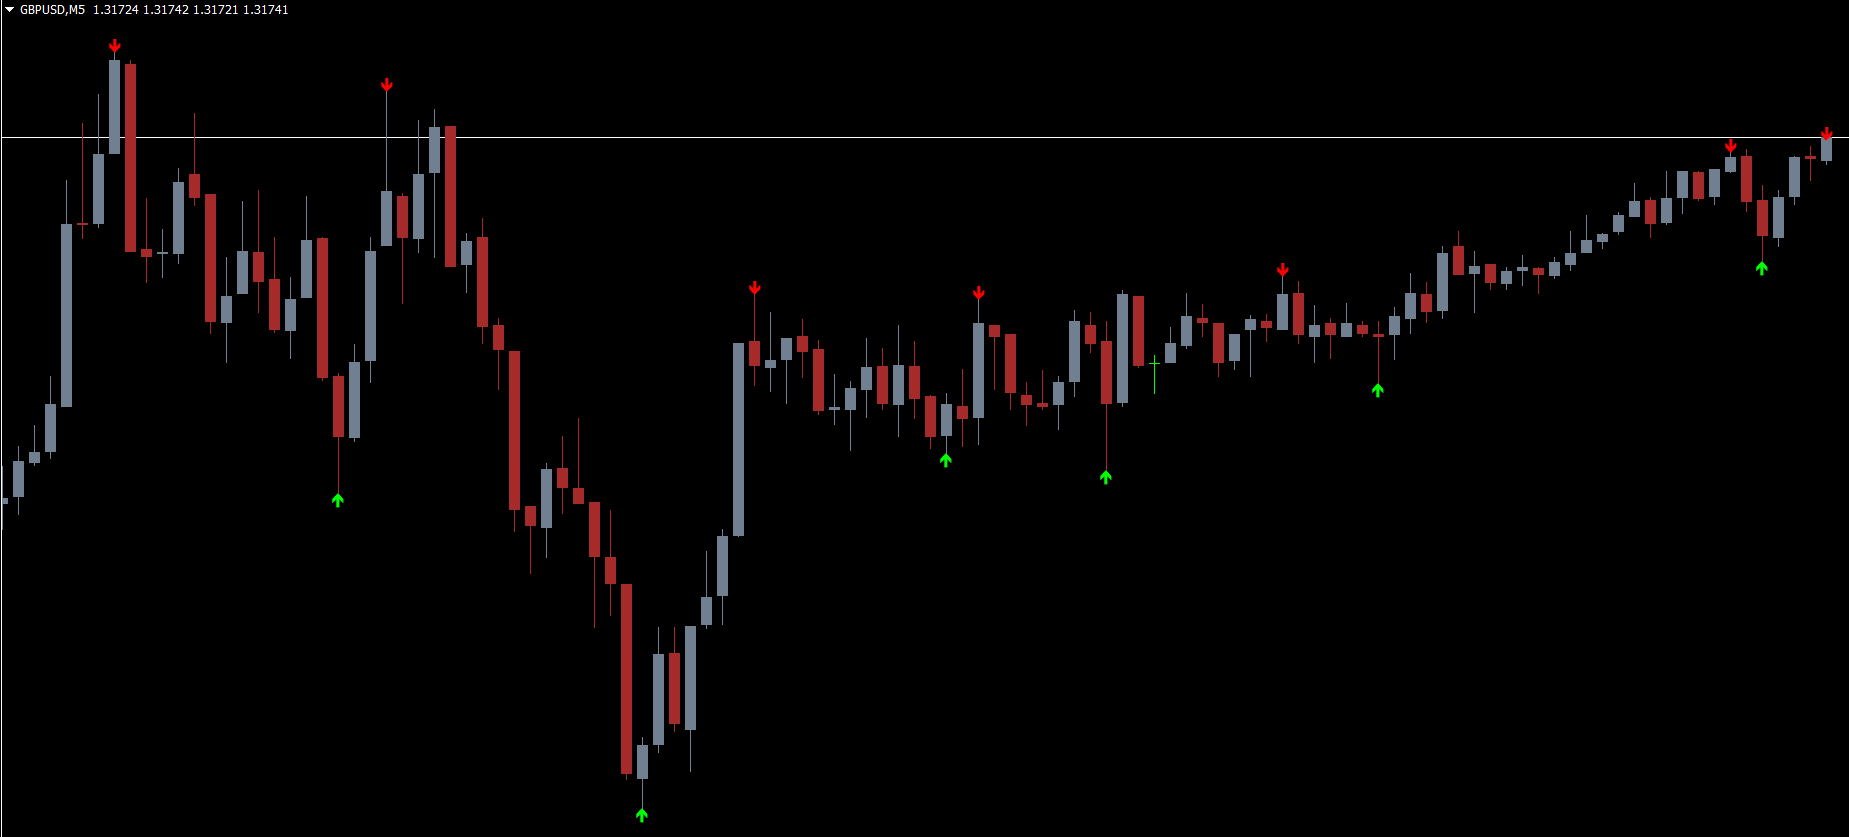
Color-Coded Buy and Sell Zones
The indicator uses a simple color coding system to signal trading opportunities:
Blue/Dark Blue: Buy signals
Red/Maroon: Sell signals
This visual system allows traders to quickly identify potential entry and exit points without spending excessive time on analysis.
Daily Open, Range, and GMT Shifts
The indicator provides important data about the daily open, the price range for the day, and GMT shifts. These features are especially useful for traders operating in multiple time zones, ensuring they can align trades with market activity accurately.
How to Use the Dolly Graphics v11 GMT Shift Indicator
To use the Dolly Graphics v11 GMT Shift Indicator effectively:
Apply it on your MT5 chart for the currency pair you want to trade.
Observe the color-coded zones for buy and sell signals.
Confirm trades using other technical analysis tools to reduce the chance of false signals in high-volatility conditions.
Track daily ranges and GMT shifts for more precise entry and exit timing.
For example, on the USD/JPY H4 chart, a blue signal indicates a buying opportunity, while a red signal suggests selling. Traders should always combine the indicator’s signals with trend analysis and risk management strategies for optimal results.
Advantages of Using Dolly Graphics v11 GMT Shift Indicator
Clear Buy/Sell Signals: Simplifies decision-making for traders.
Pivot Point Analysis: Provides strong support and resistance insights.
GMT Shift Awareness: Supports traders in global markets.
Daily Range Tracking: Helps plan trades more strategically.
By integrating this indicator into your trading routine, you can quickly identify profitable setups while minimizing risk exposure.
Conclusion
The Dolly Graphics v11 GMT Shift Indicator is a versatile and intuitive tool that highlights buy and sell zones using pivot points and historical price analysis. By leveraging its color-coded system and daily market insights, traders can enhance their MT5 trading strategies. Visit IndicatorForest.com to explore this indicator and boost your trading accuracy today.
FAQ
Published:
Nov 17, 2025 22:05 PM
Category: