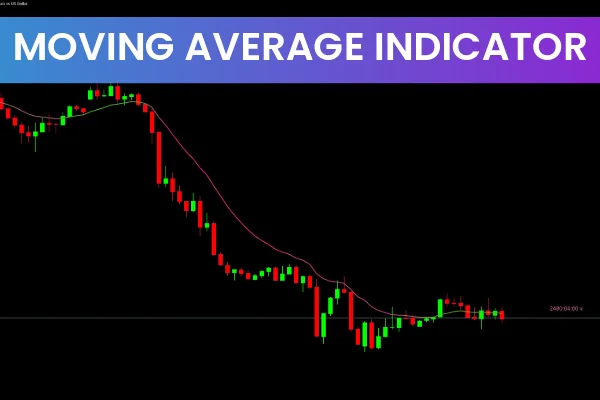
The Moving Averages Indicator for MetaTrader 5 is a modern, visual upgrade of the classic Moving Average (MA) indicator. Instead of a single static line, this version dynamically changes color to reflect market sentiment and trend direction.
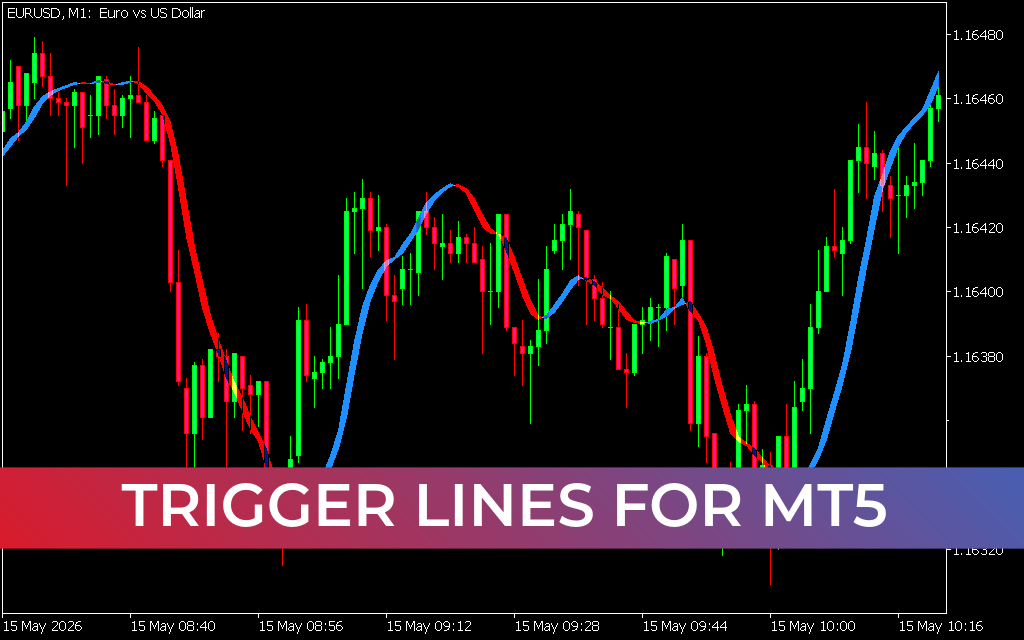
It displays a single moving average on your chart that shifts between green, pink, and transition colors—giving you an instant visual cue of whether the market is bullish, bearish, or consolidating.
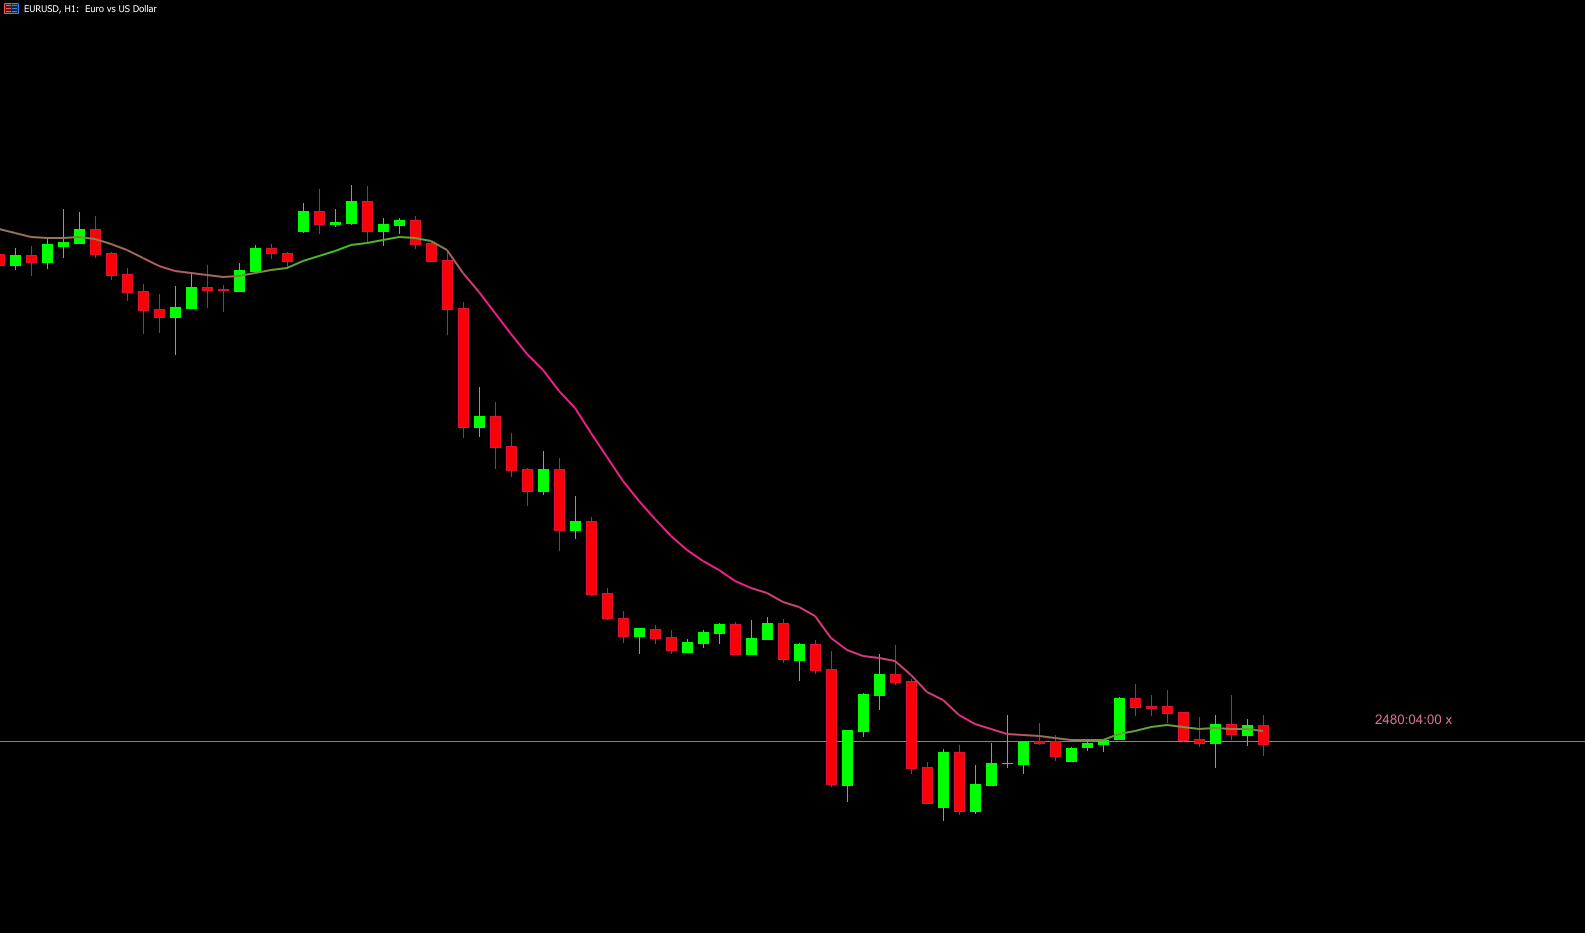
Green: Bullish trend (price is moving upward)
Pink: Bearish trend (price is moving downward)
Transition colors: Periods of consolidation or weak trend
This unique approach helps traders quickly identify momentum shifts and possible reversals without manually interpreting complex chart patterns.
How the Moving Averages Indicator Works
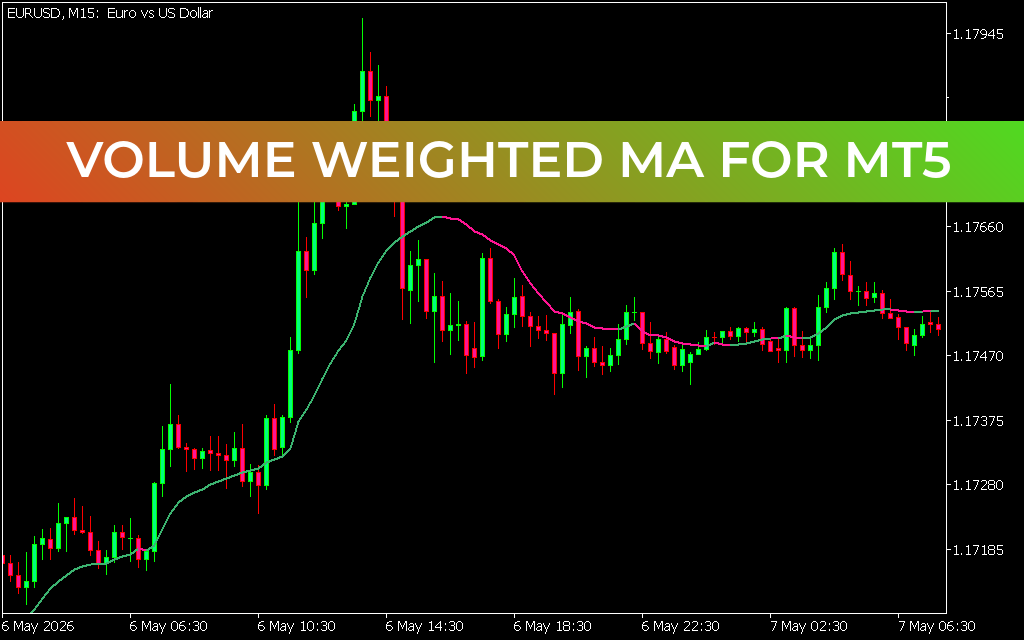
Like a standard MA, this indicator calculates the average price over a defined period. However, it visually enhances this data by coloring the line based on the current market direction.
When the MA slopes upward, it turns green to indicate a bullish trend.
When the MA slopes downward, it turns pink to show bearish conditions.
When the market enters consolidation (sideways movement), the MA color changes to a neutral or mid-tone hue.
The Moving Averages Indicator works on all timeframes and for any currency pair or asset, but for more reliable signals, it’s recommended to use higher timeframes (H1 and above) to minimize noise.
How to Trade with the Moving Averages Indicator for MT5
Buy Setup (Bullish Signal)
Wait for the Moving Average color to turn green.
Confirm that the price is above the moving average line.
Enter a BUY trade in alignment with the uptrend.
Tip: For stronger confirmation, combine this signal with another indicator such as RSI or MACD.
Sell Setup (Bearish Signal)
Wait for the Moving Average color to turn pink.
Ensure that the price is below the moving average line.
Enter a SELL trade in line with the downtrend.
Tip: Avoid entering during mixed or transition colors, as they often indicate sideways markets.
Identifying Trend Reversals
A color change on the Moving Average line often signals a potential trend reversal:
When the MA shifts from pink to green, the market may be transitioning from bearish to bullish.
When the MA changes from green to pink, it may indicate the start of a bearish move.
These visual cues can help traders anticipate possible turning points and prepare their trade setups accordingly.
Advantages of the Moving Averages Indicator
Visual clarity: Instantly shows market direction through color.
Multi-timeframe use: Works on any timeframe and instrument.
Trend Confirmation: Great for verifying price momentum.
Beginner-friendly: Easy to interpret, no complex parameters needed.
Best Practices
Use higher timeframes (H1, H4, D1) for more accurate trend detection.
Combine with momentum indicators (like RSI or Stochastic) for confirmation.
Avoid entering trades during the consolidation phase (transition colors).
Practice good risk management, as no indicator guarantees accuracy.
Conclusion
The Moving Averages Indicator for MT5 enhances the traditional moving average by adding color-coded trend visualization, allowing traders to easily spot bullish, bearish, and flat market phases.
Whether you’re a beginner or an experienced trader, this indicator simplifies chart reading and helps you stay aligned with the market’s true direction.
Download the Moving Averages Indicator for MT5 free at IndicatorForest.com and start trading with visual confidence.
FAQ
8 Downloads
Published:
Nov 11, 2025 11:09 AM
Category: