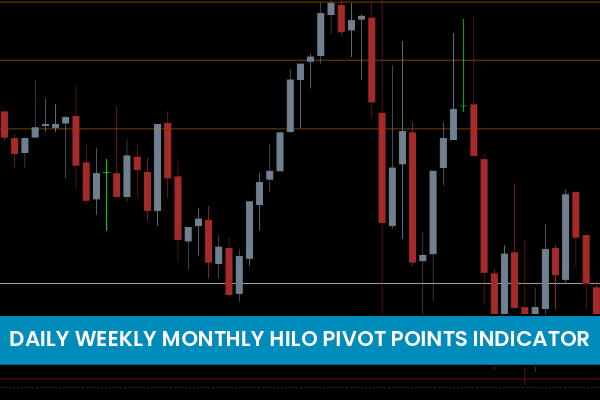
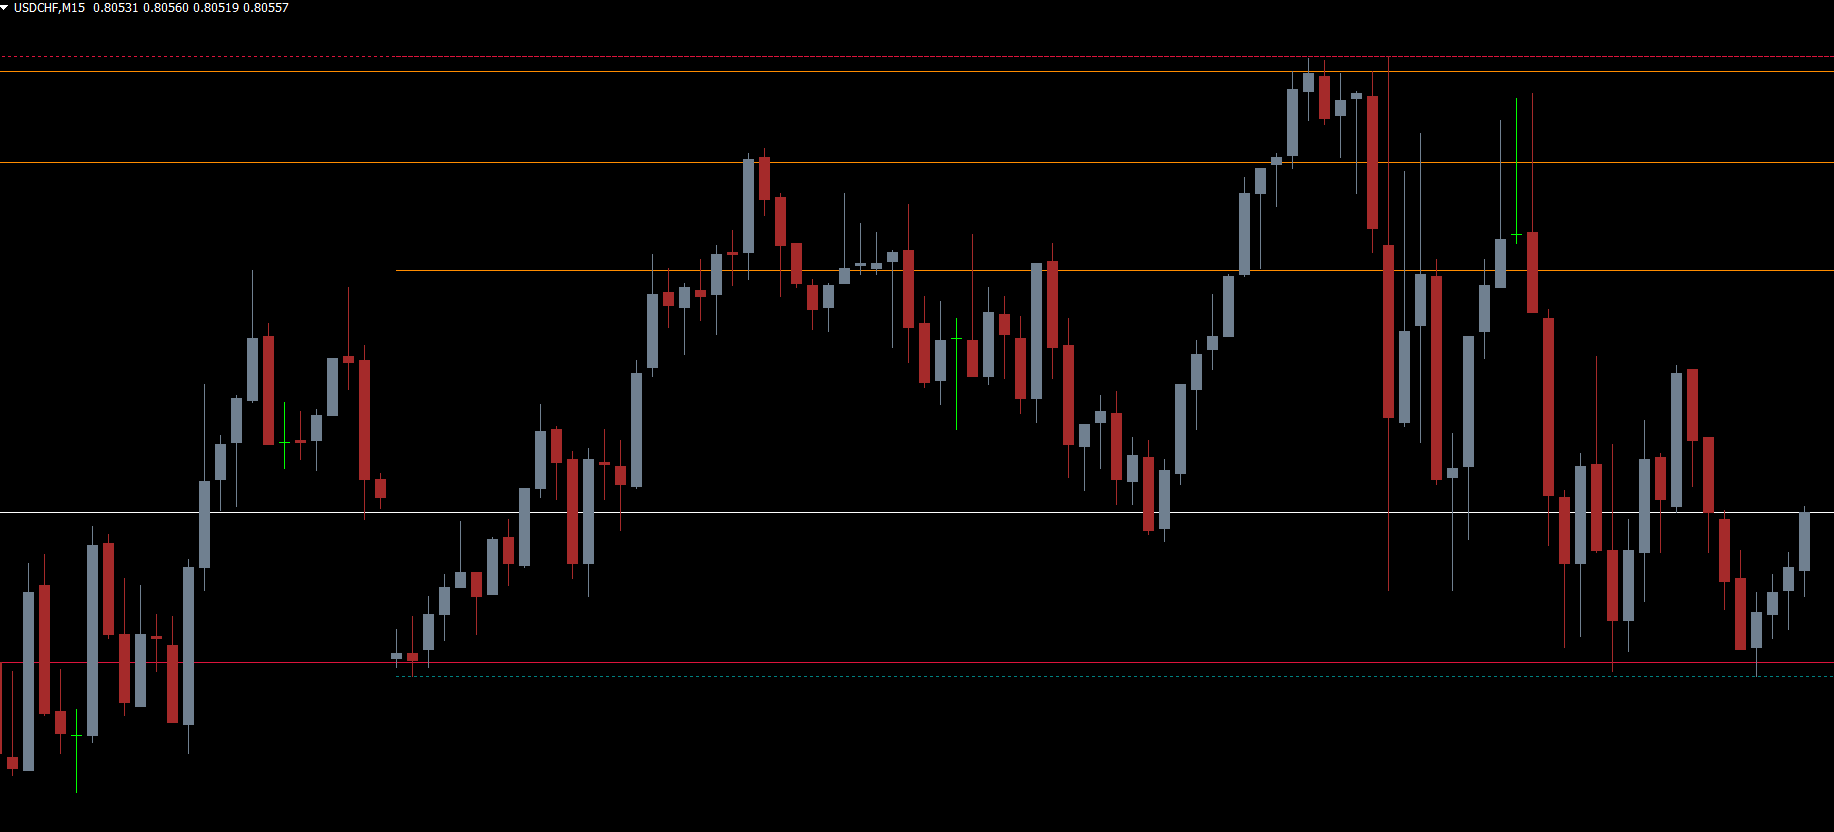
The Daily Weekly Monthly HiLo Pivot Points Indicator MT4 is one of the most advanced price-level analysis tools for MetaTrader 4. It serves as an improved alternative to traditional Support And Resistance indicators by automatically calculating pivotal zones across multiple timeframes. Because pivot points are derived from the high, low, and close values of previous periods, traders can use them to determine potential reversal points and major price reaction zones.
Professional forex traders rely on daily, weekly, and monthly pivot levels because these areas often act as strong psychological zones. Price frequently bounces, stalls, or reverses from these pivot areas, making them essential for technical analysis.
What Makes the HiLo Pivot Points Indicator Powerful?
Multi-Timeframe Pivot Calculation
The indicator calculates pivot levels for:
Daily pivots
Weekly pivots
Monthly pivots
This enables traders to quickly see the strongest support and resistance levels without switching charts.
Automatic Support and Resistance Mapping
Instead of manually drawing support/resistance, the indicator automatically plots:
High and low range levels
Central pivot point (PP)
Support zones (S1, S2, S3)
Resistance zones (R1, R2, R3)
This helps traders understand Market Structure at a glance.
Works for All Markets
Whether you trade forex, stocks, indices, commodities, or cryptocurrencies, pivot points remain universally reliable for projecting price reactions.
Why Pivot Points Matter in Technical Trading
Pivot points allow traders to:
Identify trend direction
Determine probable reversal zones
Plan entries, stop losses, and take profits
Avoid trading into strong resistance or support
Predict intraday swing highs/lows
If price cannot break above the nearest pivot resistance, it often signals bearish continuation. Similarly, failure to break below pivot support suggests bullish strength.
How to Determine Buy/Sell Levels Using HiLo Pivot Points MT4
Buy Setup Using Daily/Weekly/Monthly Pivots
A potential buy signal occurs when:
Price tests a pivot support zone (S1, S2, S3).
A bullish rejection candle forms (hammer, bullish engulfing).
Price moves back above the HiLo pivot line.
Entry: Enter BUY above confirmation candle.
Stop Loss: Below the pivot support level.
Take Profit: Next pivot resistance (R1, R2, R3).
Sell Setup Using HiLo Pivot Resistance
A bearish signal occurs when:
Price touches a pivot resistance level (R1, R2, R3).
A bearish candlestick signal forms.
Price fails to break above the resistance.
Entry: Enter SELL after confirmation.
Stop Loss: Above the pivot resistance.
Take Profit: Next support target (S1, S2, S3).
Using Pivot Points for Trend Direction
Pivot points also help determine the overall trend:
Price above the main pivot point (PP): Market is bullish.
Price below the main pivot point (PP): Market is bearish.
For higher accuracy, traders combine pivot points with:
RSI or Stochastic
Moving averages
Market structure (HH/HL or LH/LL)
Chart patterns
Volume indicators
Best Markets and Timeframes for HiLo Pivot Points
You can apply the indicator on:
M5 to H4 (intraday trading)
Daily and Weekly charts (position trading)
Markets where pivot points work exceptionally well:
Forex pairs (EURUSD, GBPJPY, USDCHF)
Gold and commodities
Major indices (US30, NASDAQ)
Crypto pairs (BTCUSD, ETHUSD)
Conclusion
The Daily Weekly Monthly HiLo Pivot Points Indicator MT4 is an essential market tool for identifying powerful support and resistance zones. It gives traders a clear roadmap of expected market reactions, making it easier to locate high-probability buy and sell areas. Whether you're a beginner or an advanced trader, pivot points should be part of your trading strategy.
For more professional MT4 and MT5 indicators, visit IndicatorForest.com.
FAQ
Published:
Nov 20, 2025 15:12 PM
Category: