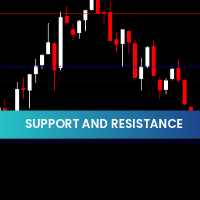
The Dinapoli Targets Indicator for MT4 is a professional Fibonacci-based tool that automatically draws Support And Resistance zones on your chart. These zones, called Dinapoli Levels, act as potential trend-reversal areas that help traders spot precise entry and exit points.
Perfect for both beginners and advanced Forex traders, the Dinapoli Targets Indicator marks buy/sell entries, take-profit zones, and stop-loss levels — making it a complete trade-planning system.
If you’re looking for an easy way to visualize Market Structure and reversal zones, download this indicator free from IndicatorForest.com.
What Are Dinapoli Target Levels?
The Dinapoli Targets are technical levels derived from Fibonacci retracements combined with recent market swing highs and lows. They are considered high-probability support and resistance zones where the price is likely to react.
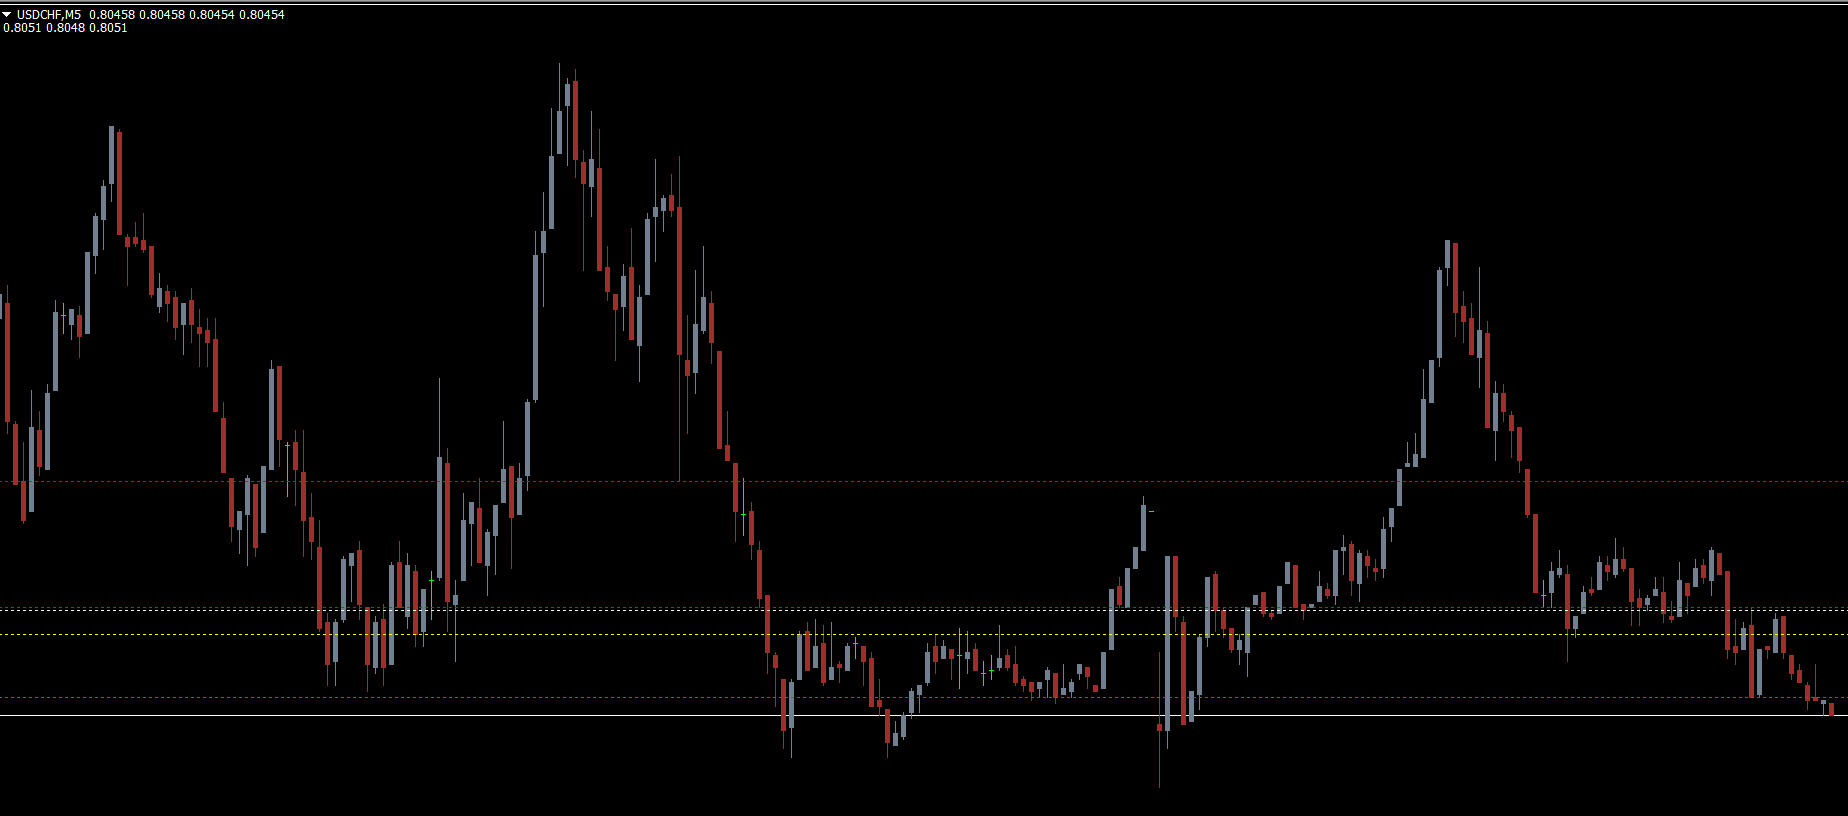
Once applied, the indicator plots horizontal dotted lines in different colors to identify:
White line: Buy/Sell entry zone
Red line: Stop-loss level
Green, Yellow, and Purple lines: Take-profit levels (TP1, TP2, TP3)
These zones provide a clear roadmap for traders — showing exactly where to enter, set stop loss, and take profits — all without manual Fibonacci plotting.
Best Timeframes and Trading Style
The Dinapoli Targets Indicator works on all MT4 timeframes, from M1 Scalping to D1 swing trading.
For scalping or intraday traders, use M15–H1 charts.
For swing traders, higher timeframes like H4 or Daily deliver more reliable setups.
The rule of thumb: the higher the timeframe, the stronger the zone’s reliability.
How to Trade Using Dinapoli Targets Indicator for MT4
Buy Setup (Bullish Signal)
Wait for the price to touch or slightly dip below the white entry line.
Confirm reversal with bullish Price Action, such as a bullish engulfing candle or hammer.
Set stop-loss at the red line and take-profit targets at green/yellow/purple lines respectively.
Sell Setup (Bearish Signal)
Wait for the price to touch or slightly move above the white line.
Confirm with bearish price action, such as a shooting star or bearish engulfing candle.
Place stop-loss at the red dotted line and aim for take-profit levels as plotted by the indicator.
Add Confluence for Higher Accuracy
Combine Dinapoli Targets with other tools such as:
RSI Divergence – for momentum confirmation
MACD Crossover – to validate trend direction
Volume Analysis – to confirm breakout or reversal strength
Advantages of Dinapoli Targets Indicator
Automatic Fibonacci plotting – No manual drawing required.
Clear entry/exit levels – Visualized buy, sell, TP, and SL zones.
Multi-timeframe compatible – Works on any chart period.
Ideal for beginners – Easy to read, interpret, and trade.
Enhances strategy precision – Use with price action for best results.
Because of its accuracy and clarity, the Dinapoli Targets Indicator simplifies complex Fibonacci trading, helping you make data-driven decisions with ease.
Conclusion
The Dinapoli Targets Indicator for MT4 is a must-have technical trading tool for anyone who relies on Fibonacci levels to find high-probability setups. It automatically identifies support, resistance, entry, stop-loss, and take-profit levels, saving time and improving accuracy.
However, traders should combine this indicator with price action patterns or momentum filters for stronger confirmations.
👉 Download the Dinapoli Targets Indicator for MT4 free now at IndicatorForest.com and start identifying professional-grade Fibonacci reversal zones instantly.
FAQ
2 Downloads
Published:
Nov 11, 2025 00:07 AM
Category: