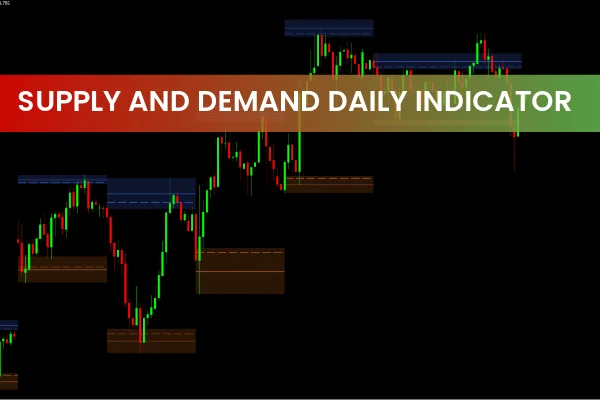
The Supply And Demand Daily Indicator for MT4 is a professional-grade tool designed to help traders identify key institutional trading zones with precision. Developed as part of the LuxAlgo suite, this indicator automatically plots supply (resistance) and demand (support) areas based on historical volume and price reactions. These zones highlight where large financial institutions, such as banks and hedge funds, have placed significant orders—causing noticeable price movements.
By visualizing these crucial areas directly on the chart, traders can better anticipate market reversals, retests, and breakouts. Whether you’re a day trader looking for quick entries or a swing trader analyzing broader Market Structure, the Supply and Demand Daily Indicator is an essential tool for aligning with institutional order flow.
What Is the Supply and Demand Daily Indicator for MT4?
The Supply and Demand Daily Indicator identifies and maps areas where the market has previously shown strong buying or selling interest. These levels are where supply exceeds demand (causing a drop) or demand exceeds supply (causing a rally).
Here’s how it works:
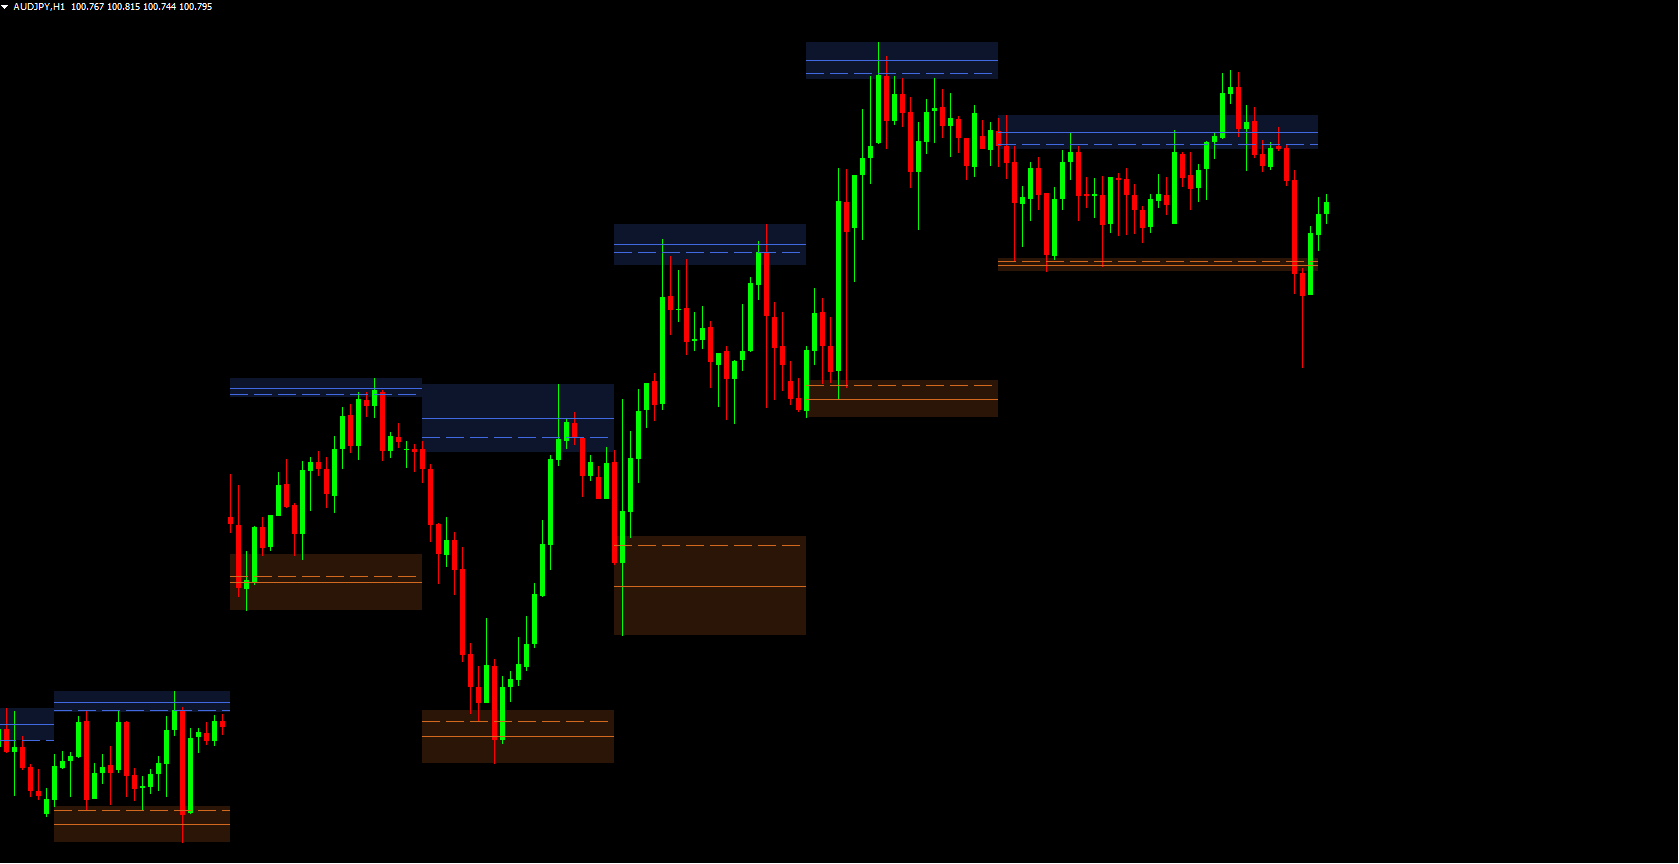
Supply Zones (Resistance): Highlighted in blue, these zones represent areas where sellers have previously dominated. When the price approaches a blue zone and fails to break higher, a bearish reversal is likely.
Demand Zones (Support): Displayed in chocolate or brown tones, these regions mark where buyers previously stepped in, often leading to bullish reversals or rallies.
Equilibrium Areas (Neutral): Shown in gray, equilibrium zones identify balanced market conditions—ideal for range-bound strategies.
This automatic mapping helps traders make data-driven decisions, reducing the guesswork often involved in manually drawing zones.
How the Indicator Generates Trading Signals
The Supply and Demand Daily Indicator for MetaTrader 4 uses a combination of volume concentration, price volatility, and historical reaction thresholds to identify potential trading opportunities.
Here’s how to interpret the signals:
Bearish Signal: When price enters a supply zone and starts to reject upward movement, it often signals a potential Trend Reversal to the downside.
Bullish Signal: When price touches a demand zone and shows strong bullish candles or rejection wicks, a bounce or upward rally may follow.
Neutral Zone: The equilibrium area suggests indecision, and traders should wait for a breakout before taking a position.
Each zone also includes average and weighted levels that show the strength and depth of institutional interest, allowing for more precise stop-loss and take-profit placements.
How to Use the Supply and Demand Daily Indicator Effectively
To get the most out of this indicator:
Trade with the Trend: Align your positions with higher timeframe trends. Use the indicator on the H4 or Daily chart to spot key institutional zones, and then look for confirmation on lower timeframes.
Wait for Confirmation: Always wait for rejection candles, volume spikes, or momentum indicators (like RSI divergence) before entering a trade.
Combine with Other Tools: The indicator works best when used alongside moving averages, Fibonacci retracements, or trendlines for additional confluence.
Set Realistic Targets: Place profit targets near the next opposing zone (supply or demand) for optimal trade management.
Avoid Low-Volume Times: Institutional activity often peaks during major sessions (London and New York). Avoid trading these zones during quiet hours.
By following these principles, traders can maximize accuracy and minimize false signals, making the Supply and Demand Daily Indicator a cornerstone of their trading toolkit.
Benefits of the Supply and Demand Daily Indicator
Automated Detection: No more manual drawing of zones.
Institutional Insights: Highlights areas influenced by large players.
Multi-Timeframe Compatibility: Works seamlessly across all MT4 chart periods.
Visual Clarity: Color-coded zones simplify technical analysis.
Strategic Edge: Enhances confluence with other indicators and Price Action tools.
This indicator not only simplifies your analysis but also helps you trade smarter, by focusing on where the most impactful market activity occurs.
Conclusion
The Supply and Demand Daily Indicator for MT4 offers traders a sophisticated yet easy-to-use way to understand institutional price behavior. By automatically identifying key zones of supply, demand, and equilibrium, it empowers traders to make more informed and confident decisions.
For anyone looking to improve consistency and precision in trading, the Supply and Demand Daily Indicator is a must-have tool.
Explore and download the indicator today at IndicatorForest.com — your trusted source for professional MT4 and MT5 indicators that enhance trading accuracy and confidence.
27 Downloads
Published:
Nov 03, 2025 13:27 PM
Category: