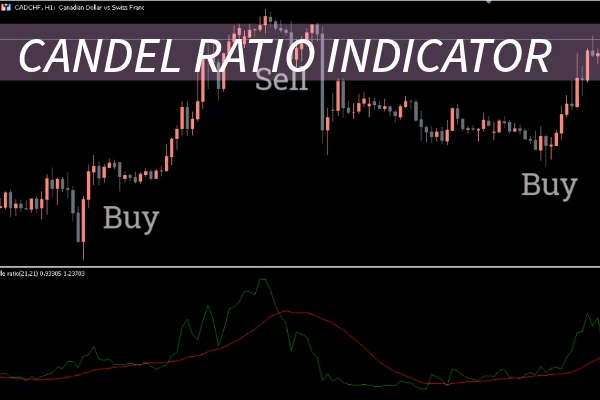
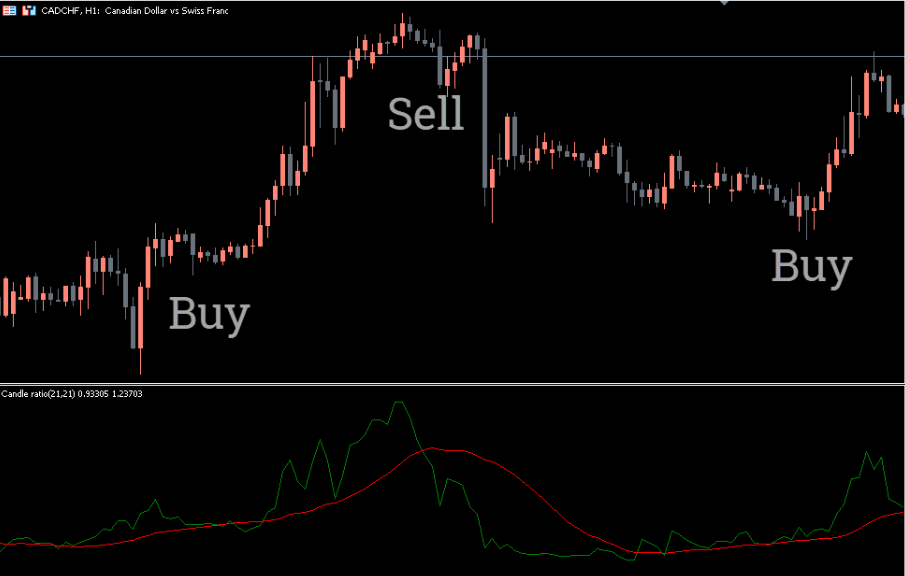
The Candlestick Ratio Indicator for MT5 is a powerful oscillator designed to measure the ratio between bullish and bearish candles over a defined period. By analyzing these ratios, traders can quickly understand which market participants — buyers or sellers — are currently in control. This insight is vital for identifying potential reversals, continuation patterns, and the overall market sentiment in Forex trading.
Unlike complex analytical tools, the Candlestick Ratio Indicator for MT5 offers a simple visual representation of market strength. Whether you are a beginner or an experienced trader, this indicator can help you confirm trends and refine your trading strategies with confidence.
The indicator displays a green oscillator line in a separate MT5 window.
When the oscillator rises, it shows that buyers (bulls) dominate the market.
When it falls, it signals that sellers (bears) are gaining strength.
The slope and position of the oscillator can also indicate momentum changes. Traders can draw support and resistance levels on the oscillator to pinpoint possible price reversals or trend continuations.
For instance:
If the oscillator breaks above resistance, it could mark the start of a bullish phase.
A drop below support often signals bearish pressure or a possible retracement.
When applying this indicator to your MT5 chart, consider the following basic trade setup:
Buy Signal
Wait for the oscillator line to turn upward after a decline.
Enter a buy trade when bullish momentum strengthens.
Place a stop loss below the recent swing low to protect your position.
Sell Signal
Observe when the oscillator reverses downward from a high.
Enter a sell position as bearish strength increases.
Place a stop loss above the previous swing high.
Traders should also monitor the oscillator for divergences — when price and the oscillator move in opposite directions — as these often hint at potential reversals.
This indicator offers several benefits:
Clear visualization of market dominance.
Works on all timeframes, from intraday to long-term charts.
Compatible with other technical indicators, such as RSI or MACD.
Simple to interpret, making it suitable for all experience levels.
Using the Candlestick Ratio Indicator for MT5 as part of a broader trading system allows traders to confirm signals and improve entry and exit accuracy. Many traders find it particularly effective when combined with trend-following or price action strategies.
Combine it with moving averages or volume indicators to confirm trends.
Test the indicator on demo accounts before using it in live trading.
Use support and resistance zones on both the price chart and the oscillator for confirmation.
Remember, no single tool guarantees success. A disciplined approach, proper risk management, and patience are key to long-term profitability.
The Candlestick Ratio Indicator for MT5 is an easy-to-use oscillator that helps Forex traders identify market dominance between bulls and bears. It provides clear, actionable insights that can improve both short-term and long-term trading decisions.
To download or learn more about this and other MT5 trading tools, visit IndicatorForest.com — your trusted source for professional Forex indicators, expert advisors, and trading solutions designed to help you trade smarter.
Published:
Oct 13, 2025 04:49 AM
Category: