Elevate Your Trading Precision with the XO Indicator for MT4
In the highly competitive landscape of the foreign exchange market, technical traders are constantly seeking tools that distill complex Price Action into clear, actionable signals. The XO Indicator for MetaTrader 4 (MT4) is a professional-grade trend-following tool designed to do exactly that. By utilizing a sophisticated smoothing algorithm, the XO Indicator removes market "noise," allowing traders to identify the core directional bias of any asset with institutional-level clarity.
The Mechanics of Trend Filtering
The XO Indicator belongs to the class of momentum oscillators, but with a primary focus on trend persistence. Unlike standard oscillators that often provide premature reversal signals in strong trending markets, the XO is engineered to keep traders on the right side of the move for as long as the momentum remains valid.
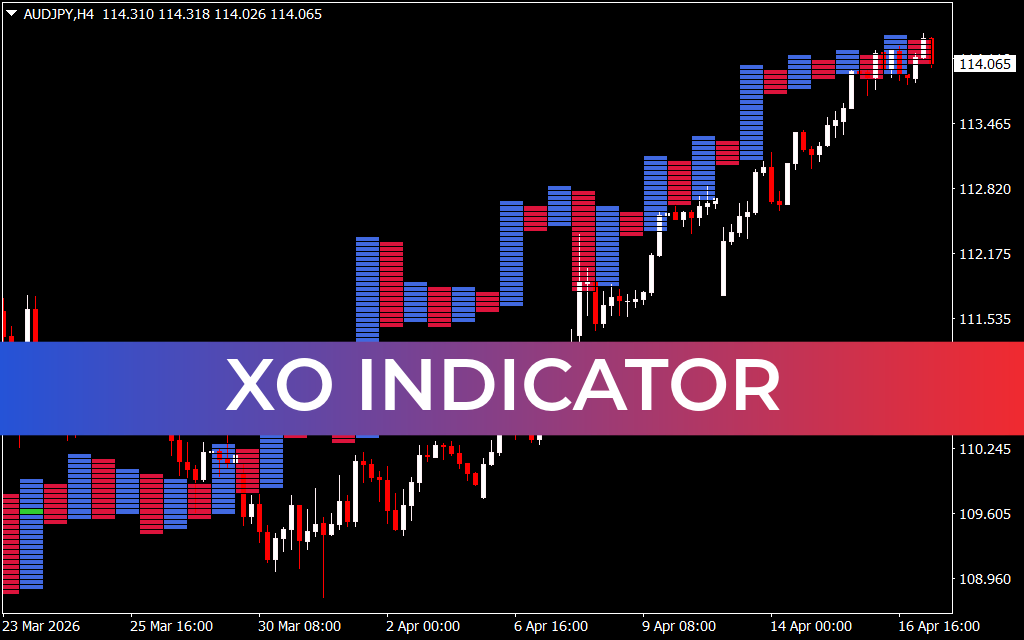
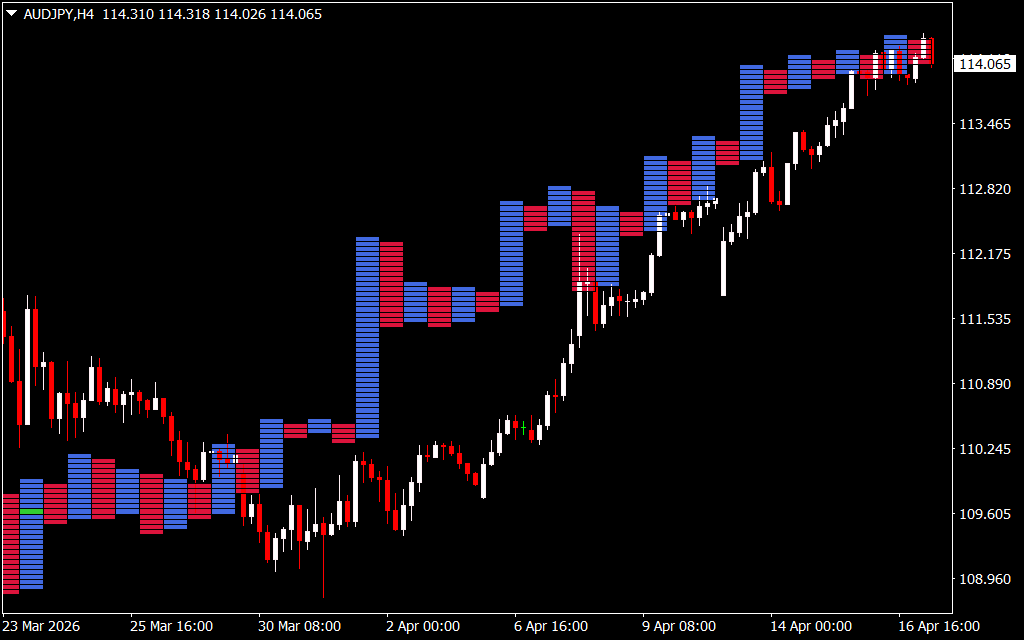
As seen in technical applications across major currency pairs like AUD/JPY on the H4 timeframe, the XO Indicator offers a definitive visual framework:
- Intuitive Color-Coded Histograms: The indicator operates in a dedicated sub-window, utilizing a series of vertical bars. Typically, blue or green bars signify a dominant bullish regime, while red bars indicate a bearish trend. This binary visual system eliminates the hesitation often associated with manual chart reading.
- Cluster Analysis: Unlike a single-line oscillator, the XO provides a "block" or "cluster" of data. When these blocks align in a solid color, it confirms a high-conviction trend. As demonstrated on the AUD/JPY H4 chart, these blocks act as a visual representation of market consensus.
- Volatility-Adjusted Signals: The XO algorithm incorporates a smoothing factor that ignores minor price fluctuations. This ensures that the indicator only changes color when a genuine shift in Market Structure has occurred, drastically reducing the number of false "whipsaw" signals.
- Precision Entry and Exit Points: The first bar of a new color serves as a high-probability trigger for a trade entry. Conversely, when the bars begin to thin or change color, it provides a leading warning to tighten stop-losses or exit the position entirely.
Strategic Advantages for Professional Traders
The XO Indicator is an essential asset for any trader who values systematic, data-driven execution over subjective interpretation.
- Objective Market Bias: By providing a clear color-coded output, the XO removes the emotional bias that often leads traders to fight against the prevailing trend.
- Universal Compatibility: Whether you are Scalping the M1 charts or swing trading the Daily timeframes, the XO algorithm maintains its mathematical integrity, making it suitable for all trading styles.
- Perfect for Confluence: The XO serves as an ideal secondary confirmation tool. When a price action signal (like a breakout) occurs simultaneously with an XO color change, the probability of a successful trade increases exponentially.
- Capital Preservation: By identifying trend exhaustion early, the XO helps traders avoid the "trap" of entering a move that has already run its course.
Conclusion
The XO Indicator for MT4 is a definitive tool for the modern technical analyst. By bridging the gap between raw price action and smoothed momentum analysis, it empowers you to navigate the financial markets with professional-grade confidence. Elevate your MT4 terminal today and start trading with the technical precision of the XO Indicator.
SEO Meta Description
16 Downloads
Last Update:
Apr 17, 2026 14:59 PM
Published:
Feb 09, 2026 12:50 PM
Category: