Master Volatility Cycles with the B Bandwidth Ratio Indicator for MT4
In the world of technical analysis, Price Action is often viewed as a cycle of expansion and contraction. While many traders focus on identifying trend direction, professional market participants prioritize understanding volatility. The B Bandwidth Ratio Indicator for MetaTrader 4 (MT4) is a specialized analytical tool derived from Bollinger Bands that quantifies the narrowing and widening of price channels. By measuring the percentage difference between the upper and lower bands, this indicator identifies high-probability "Squeeze" setups, signaling when the market is coiled and ready for an explosive breakout.
The Mechanics of Volatility Measurement
The B Bandwidth Ratio is more than just a momentum oscillator; it is a structural gauge of market energy. Traditional Bollinger Bands expand during high volatility and contract during low volatility. This indicator takes that visual data and transforms it into a precise mathematical ratio displayed in a separate oscillator window. This allows traders to identify objective exhaustion points and breakout triggers without the visual clutter of bands on the main price chart.
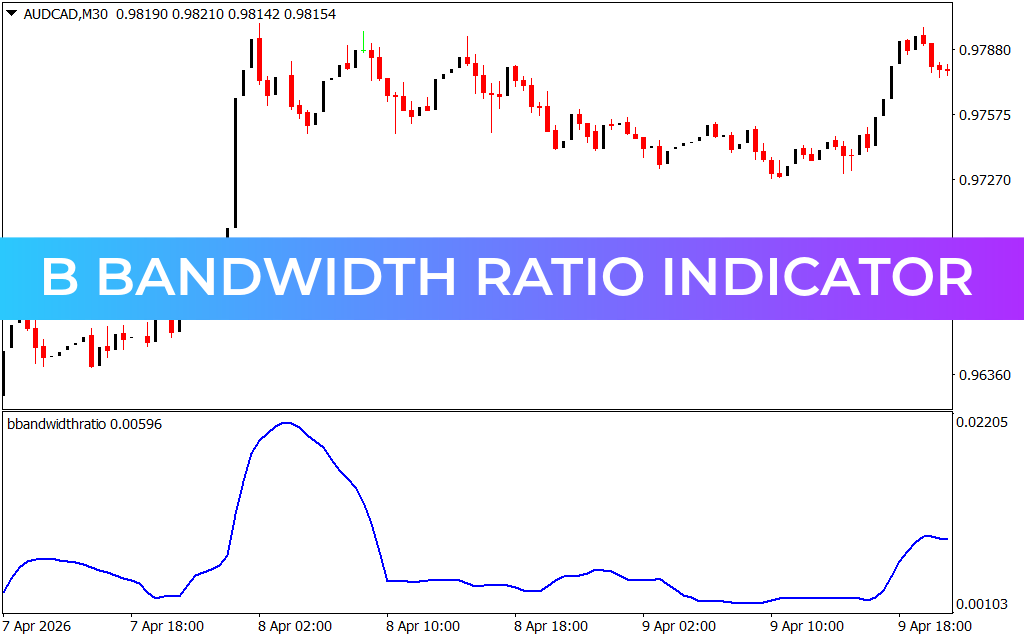
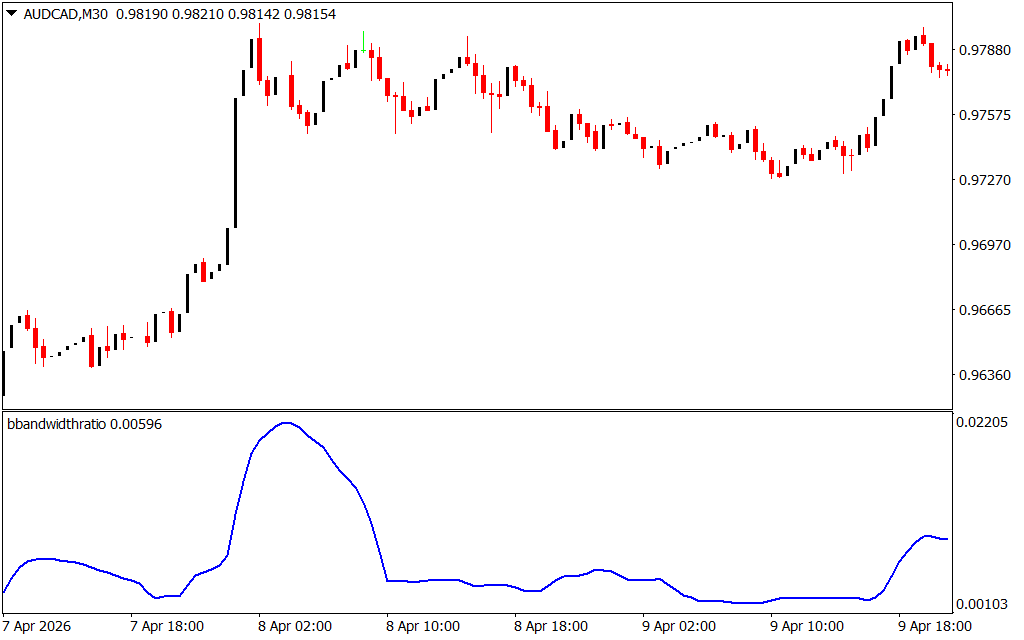
As observed in technical analysis across pairs like AUD/CAD on the M30 timeframe, the B Bandwidth Ratio system provides a definitive strategic advantage:
- Identifying the Bollinger Squeeze: The most powerful signal provided by this indicator is the "Squeeze." As seen on recent M30 structural charts, when the ratio line reaches a historical low, it indicates that volatility is unusually suppressed. Statistically, prolonged periods of low volatility are followed by aggressive price expansion.
- Confirming Breakout Strength: When price breaks out of a consolidation zone, the B Bandwidth Ratio line will begin to spike aggressively. This rising ratio confirms that the move is supported by increasing market participation and volatility, helping traders distinguish between legitimate breakouts and "fake-outs."
- Spotting Trend Exhaustion: Just as low ratio values signal a pending move, extreme high values signal a potential climax. If the ratio reaches an unsustainable peak, it suggests the trend is overextended and a mean-reversion move or consolidation phase is imminent.
- Surgical Precision for Scalpers: On lower timeframes like the M5, the B Bandwidth Ratio helps scalpers identify quick bursts of volatility, allowing them to enter trades exactly when the market "energy" is released from its vault.
Strategic Integration for Systematic Success
The B Bandwidth Ratio Indicator is an essential asset for any trader who values a disciplined, rule-based approach to the markets.
- Volatility Filtering: Use the indicator as a "Go/No-Go" filter. If the ratio is flat or at a median level, the market lacks the energy for a significant move. Only look for setups when the ratio is at a historical extreme (Squeeze).
- Confluence with Directional Indicators: Combine the B Bandwidth Ratio with a directional tool like a Moving Average or RSI. The Ratio tells you when to trade, while the directional tool tells you where to trade.
- Risk Management: Use volatility peaks to define profit targets. Exiting a position as the B Bandwidth Ratio begins to roll over from a high peak allows you to capture the bulk of a move before the inevitable contraction begins.
Conclusion
The B Bandwidth Ratio Indicator for MT4 is a definitive solution for traders who demand structural clarity and objective volatility data. By bridging the gap between price movement and mathematical expansion, it empowers you to navigate the financial markets with professional-grade precision. Elevate your MT4 terminal today and master the cycles of market energy with the B Bandwidth Ratio system.
2 Downloads
Last Update:
Apr 17, 2026 23:46 PM
Published:
Feb 08, 2026 10:36 AM
Category: