Master Trend Momentum with the Moving Average of Oscillator (OsMA) for MT4
In the fast-paced world of technical analysis, traders often struggle with the "lag" inherent in traditional indicators. While standard moving averages and momentum tools provide valuable data, they frequently deliver signals after a significant portion of the move has already occurred. The Moving Average of Oscillator (OsMA) for MetaTrader 4 (MT4) is a professional-grade analytical tool designed to solve this problem by identifying the acceleration and deceleration of momentum in real-time. By calculating the difference between an oscillator and its moving average, the OsMA acts as a "leading" signal for potential trend reversals and explosive breakouts.
The Mechanics of Momentum Acceleration
The OsMA is technically the difference between the main MACD line and the signal line. When the OsMA histogram is rising, it indicates that momentum is accelerating in the direction of the trend. When it begins to shrink, it warns of a potential trend exhaustion—often long before Price Action confirms the reversal.
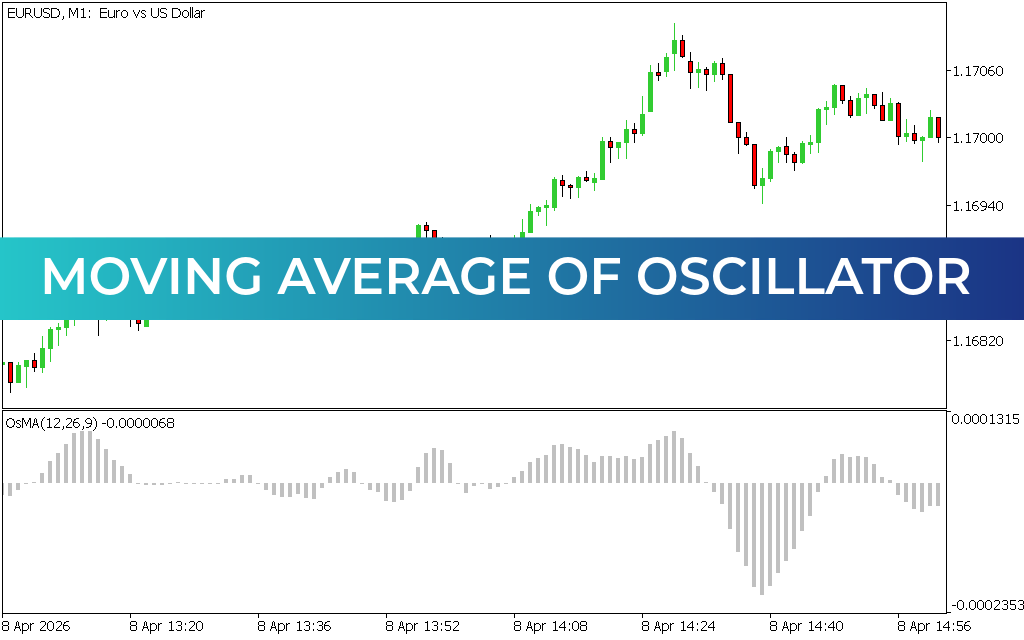
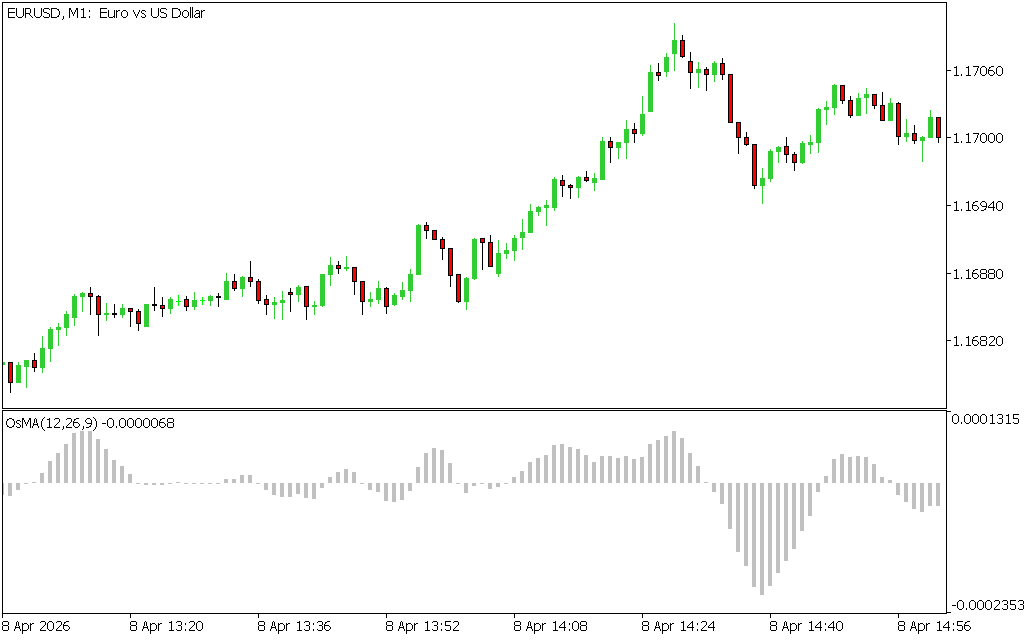
As observed in technical analysis on high-liquidity pairs like EUR/USD on the M1 timeframe, the OsMA provides a definitive operational edge:
- Histogram-Based Sentiment: The indicator features a clear visual histogram that oscillates around a central zero line. As seen on recent M1 structural charts, a shift from negative to positive bars signals a bullish momentum surge, while a move from positive to negative bars confirms a bearish takeover.
- Leading Reversal Signals: One of the OsMA's greatest strengths is its ability to spot trend exhaustion. When the histogram bars reach an extreme height and begin to shorten toward the zero line, it provides a mechanical "heads up" to tighten stops or exit positions before the price turns.
- Precision Divergence Detection: The OsMA is world-class at identifying hidden divergences. If the price makes a higher high but the OsMA histogram makes a lower high, it indicates that the underlying momentum is failing, signaling a high-probability reversal opportunity.
- Institutional Structural Clarity: By quantifying the "delta" between price averages, the OsMA allows retail traders to see the same momentum exhaustion levels that institutional algorithms use to trigger large-scale orders.
Strategic Implementation for Professional Traders
The Moving Average of Oscillator is an essential asset for any trader who values a systematic, data-driven approach.
- Trend Continuation Cues: In a strong trend, use the OsMA to time your entries on "pullbacks." Wait for the histogram to dip toward the zero line and then enter as soon as it begins to expand again in the direction of the primary trend.
- Surgical Scalping: On lower timeframes like the M1 or M5, the OsMA's responsiveness makes it a premier tool for quick momentum bursts, helping scalpers capture rapid price displacements.
- Cross-Timeframe Verification: Align the OsMA across timeframes for maximum conviction. A bullish histogram on the H1 combined with a fresh zero-line cross on the M15 creates a top-tier trade setup.
Conclusion
The Moving Average of Oscillator (OsMA) for MT4 is a definitive solution for traders who demand more than just lagging price data. By bridging the gap between historical averages and real-time momentum acceleration, it empowers you to navigate the financial markets with professional-grade clarity. Elevate your technical analysis today and master the flow of market momentum with the OsMA system.
3 Downloads
Last Update:
Apr 18, 2026 00:00 AM
Published:
Feb 08, 2026 10:30 AM
Category: