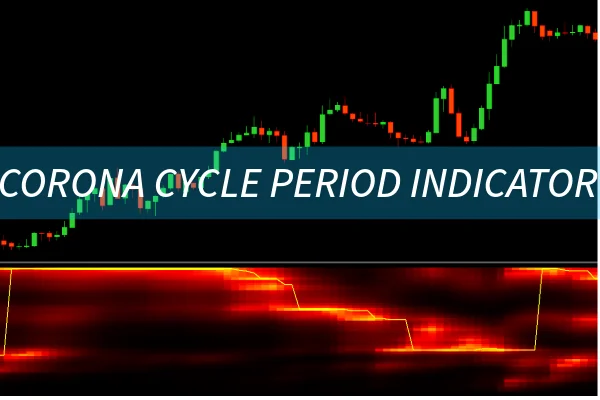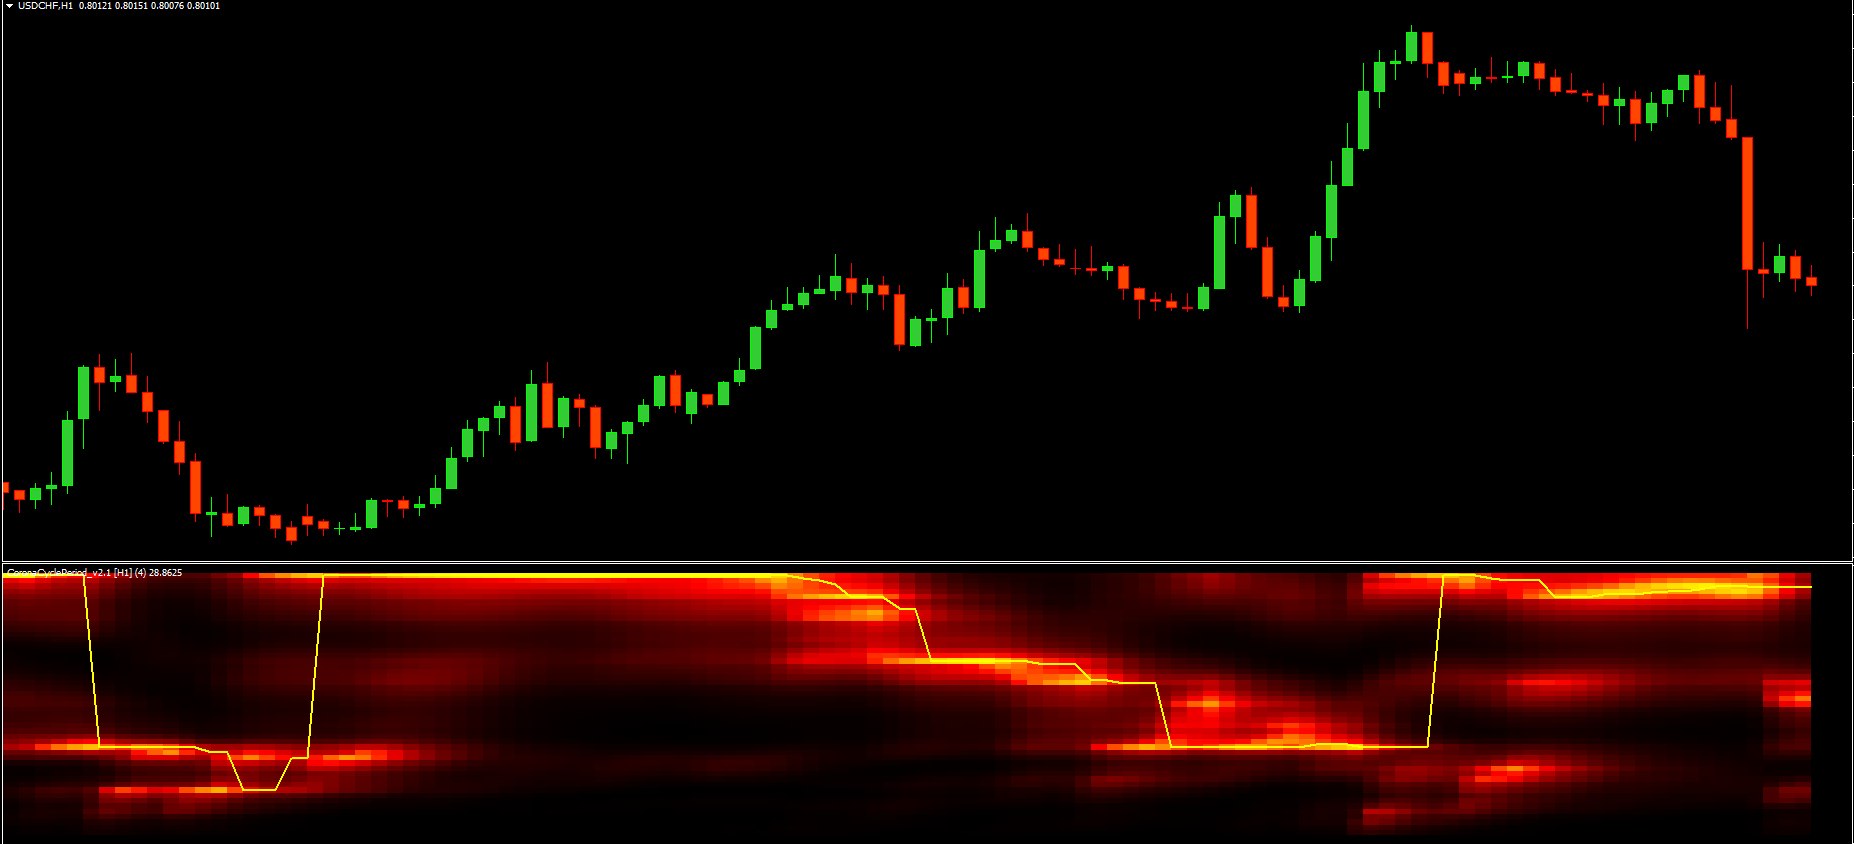
The Corona Cycle Period Indicator for MT4 is a powerful technical analysis tool designed to detect market cycles by correlating price action with sine and cosine waves. When the indicator shows a positive correlation, it signals a bullish trend, whereas a negative correlation points to a bearish trend. By recognizing these correlations, traders can determine when a current uptrend or downtrend is ending—or when a new market cycle is beginning.

At IndicatorForest.com, we provide professional-grade trading tools like the Corona Cycle Period Indicator to help traders identify precise entry and exit points across different forex time frames.
The indicator plots its data in a separate indicator window, offering a clear visual representation similar to heat map signals. These plotted values typically range between 5 and 31, with a midline level at 17.5 to distinguish between bullish and bearish cycles:
Above 17.5: Indicates an ongoing uptrend.
Below 17.5: Suggests a downtrend is in motion.
Crossing 17.5: Signals the end of one market cycle and the start of another.
This design allows traders—whether beginners or experienced professionals—to interpret market conditions at a glance.
To trade effectively with the Corona Cycle Period Indicator for MT4, follow these practical strategies:
Buy Signal:
When the indicator crosses above the 17.5 midline, it suggests a new bullish phase.
Enter a buy trade with a stop loss just below the previous swing low.
Hold your position until the indicator drops below 17.5 again, signaling a potential trend reversal.
Sell Signal:
When the indicator falls below 17.5, it points to a bearish market phase.
Enter a sell trade and place your stop above the recent swing high.
Exit when the indicator rises back above the midline.
A risk-reward ratio (RR) of at least 1:2 is recommended for optimal performance. The indicator works across all chart timeframes, but higher time frames—such as H4 or daily charts—tend to produce more reliable signals.
Simplified Market Visualization
Its clear graphical representation helps you visualize market momentum and cycles instantly.
Adaptable for All Trading Styles
Whether you’re a swing trader, scalper, or position trader, the indicator adjusts seamlessly across different timeframes and currency pairs.
Suitable for Beginners and Experts
New traders can use the indicator’s color-coded and line-based design to interpret signals easily, while advanced traders can combine it with other algorithmic trading tools for deeper analysis.
Combine the Corona Cycle Period Indicator with moving averages or RSI for confirmation signals.
Avoid trading during low-liquidity periods or major news events.
Regularly backtest your strategy to adapt to changing market dynamics.
For a detailed comparison of professional trading tools, visit our Algorithmic Trading Tools page at IndicatorForest.com.
To understand the math behind sine-cosine cycle analysis, check these trusted sources:
Investopedia – Understanding Market Cycles
Babypips – Forex Market Phases
In summary, the Corona Cycle Period Indicator for MT4 leverages sine and cosine mathematical models to identify cyclical price behavior in the forex market. By analyzing correlations, it helps traders predict the start and end of market trends—empowering them to make informed buy or sell decisions.
Take your trading accuracy to the next level by downloading professional indicators like this one from IndicatorForest.com today.
Published:
Oct 11, 2025 04:04 AM
Category: